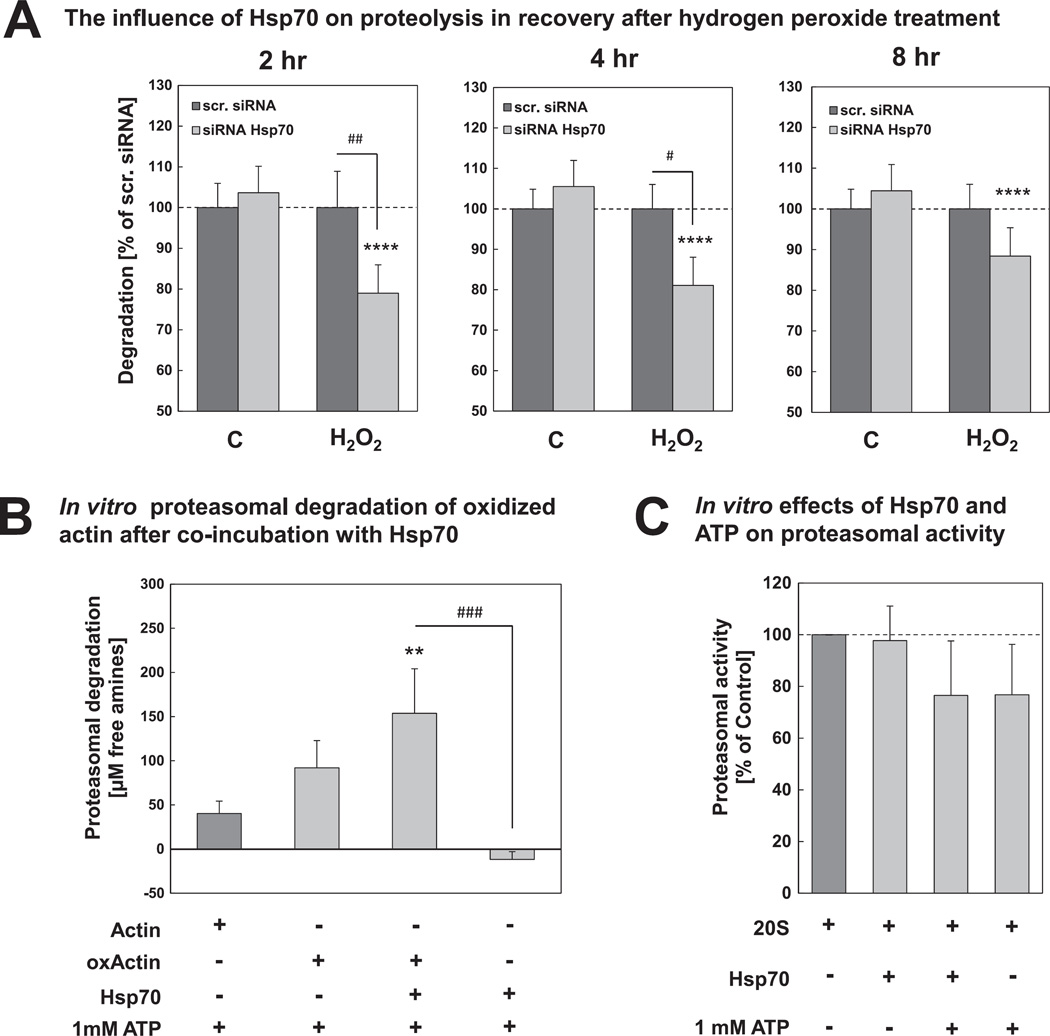
Fig. 5.
Proteasomal degradation is increased in the presence of Hsp70. (A) HT22 cells were transfected with 25 nM scr. siRNA or 25 nM Hsp70 siRNA 24 hr after seeding. 72 hr after transfection, cells were incubated with growth medium, containing [35S]-labeled methionine and cysteine for 2 hr (for details see Section 2), washed and treated with 0.5 mM hydrogen peroxide or PBS for 0.5 hr. Afterwards, growth medium supplemented with 10 mM methionine/cysteine was added. Proteolytic degradation was measured at the desired time points in recovery after oxidative stress, as described in Section 2. The columns represent the proteolytic degradation (in % of scr. siRNA samples) at different time points after oxidative stress. They are the means ± SD, n = 7–9. ****P < 0.001 vs. control cells, ## P < 0.01 vs. scr. siRNA, # P < 0.05 vs. scr. siRNA. (B) Actin was incubated with hydrogen peroxide for 2 hr at 25 °C. Afterwards, hydrogen peroxide was removed by adding catalase. Oxidized actin (oxActin) was incubated with isolated 20S proteasome and with Hsp70 for 2 hr at 37 °C. Non-oxidized, native actin was used for comparison. Controls for each sample were incubated without the addition of 20S proteasome. The proteasomal degradation was measured using fluorescamine assay (for details see methods). The columns represent the proteasomal degradation, calculated as the difference between proteasome and control samples, respectively. They are the means ± SD, n = 3–4. **P < 0.01 vs. actin control, ### P < 0.005 vs. Hsp70 control. (C) Isolated 20S proteasome was incubated with Hsp70 and/or ATP and proteasomal activity was measured using the fluorogenic proteasome substrate suc-LLVY-MCA as described in methods. Columns are the means ± SD, n = 3.

