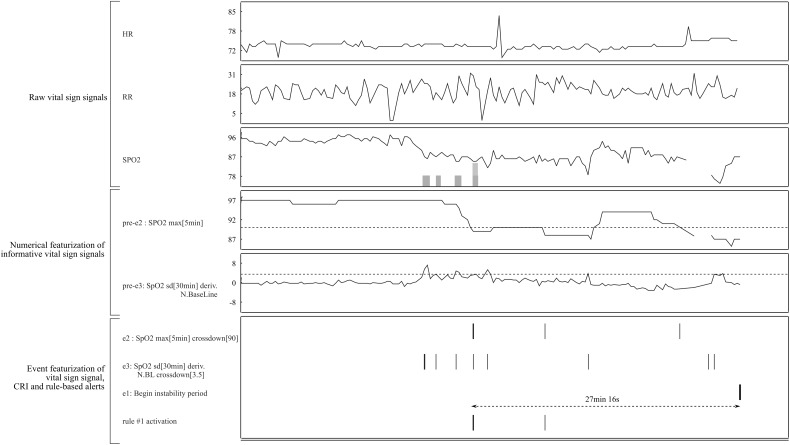
Figure 5.
Example of an enhanced bedside monitor display for a particular CRI alert (the right part of the plot). Top rule #1 (Figure 4) becomes active 27 minutes before the onset of the CRI. This rule relies on 2 events (e2 and e3), which in turn rely on the featured signal (pre-e2 and pre-e3). When the rule activates, displaying the current and past values of e2, e3, pre-e2, pre-3 amd the thresholds used to compute e2 and e3 can provide an indication of the reason for issuing the alert. To further simplify display of the justification, we can show just the raw time series of the VSs observed during periods of time that led to rule activation (in this case, periods of suspicious behavior of SpO2 marked by the shaded areas overlaid in the plot of its time series).

