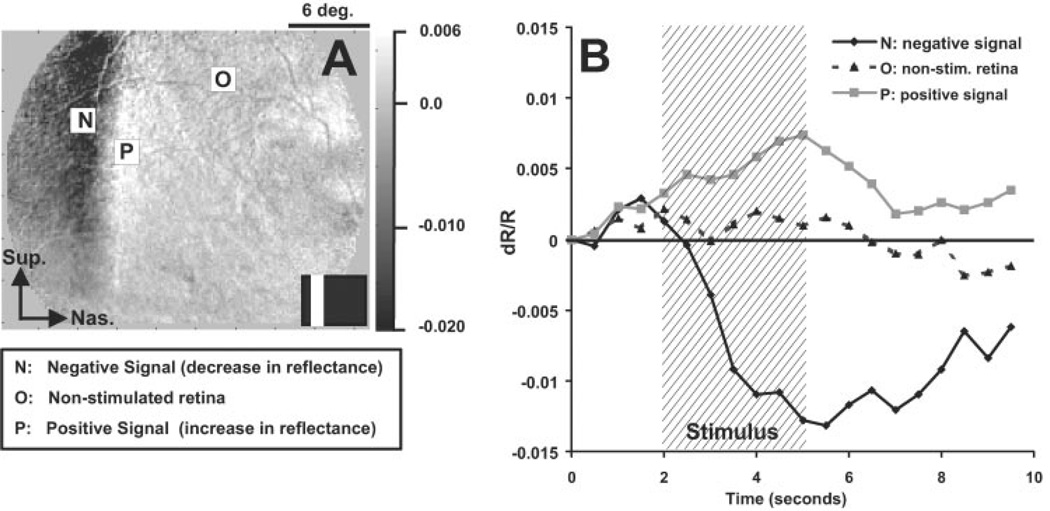
Figure 1.
Spatial properties and quantification method. (A) NIR response to a vertical bar on a dark background. The presentation of patterned visual stimuli produced two predominant signals of opposite polarity, a negative signal (N) and a positive signal (P), that were spatially adjacent. Right: Grayscale bar representing fractional change in reflectance (dR/R). Negative signals correspond to a decrease in reflectance (dark regions). Conversely, positive signals correspond to a relative increase in reflectance (light regions). Areas that show no or slight reflectance change are gray regions (dR/R = 0). The response is localized with the stimulated retina. Scale bar: 6° of visual angle. Arrows: superior and nasal directions in the fundus image. Inset: the stimulus used to evoke the response. (B) Fractional reflectance time course of three ROIs. The signal intensity is plotted as a function of time. The fractional reflectance for each ROI was calculated (see Schallek et al.6). Both the positive (ROI P, white) and negative signal (ROI N, black) showed negligible deviation from baseline during the prestimulus epoch (0–2 seconds). Between 2 and 5 seconds (stimulus on), both signals appeared and developed in magnitude. In the poststimulus epoch (5–10 seconds) both signals slowly recovered toward the baseline reflectance (dR/R = 0). An ROI over the nonstimulated region of retina is also plotted (O, dashed lines). Reflectance changes were very small, most likely attributable to the biological noise of the system.

