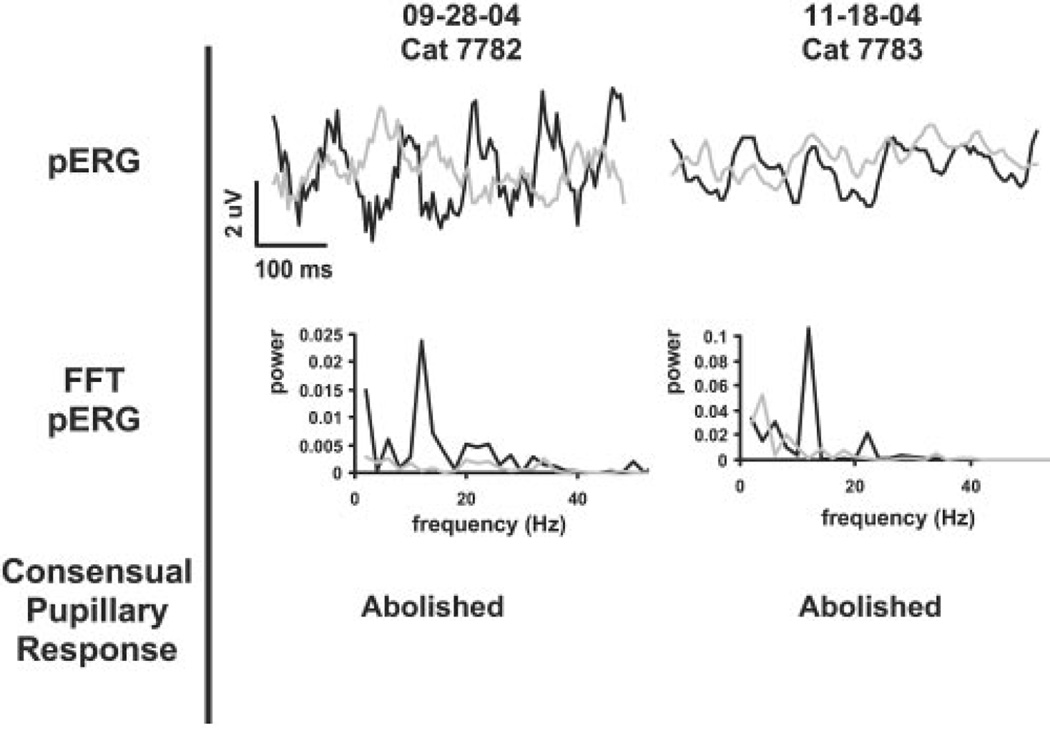
Figure 3.
Alternative measures of retinal function. Pattern ERG (pERG) responses were recorded in conjunction with optical imaging. Top: the pERG response from two animals injected with TTX. Black trace: the pERG response before injection, with a clear stimulus frequency-doubled response. At least 1 hour after injection (gray trace), the pERG showed minimal response corresponding to the reversal rate of the stimulus. Middle: the FFT power spectra of the raw pERG response. A strong 12-Hz component corresponding to the frequency-doubled response was seen in the noninjected condition, whereas after injection, the power at that frequency was attenuated by up to two orders of magnitude. Bottom: absence of the consensual pupillary reflex after injection (Abolished). The reflex was present before injection, but was abolished after injection indicating signal disruption to higher visual areas. Taken together, these findings confirm the desired suppression of ganglion cell function.

