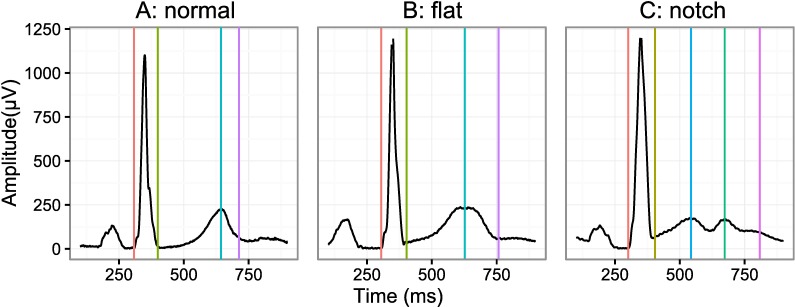
Fig 2. ECG examples.
A set of ECG examples showing the different type of ECG morphologies observed in the two prospective clinical trials. From left to right the panels represent a normal T-wave (A), flattened T-wave (B) and a T-wave with a prominent notch (C), the latter is only observed in 0.8% of the ECGs in FDA study 1 and never observed in FDA study 2. Lastly, the vertical lines correspond to the QRS onset (red), QRS offset (green), primary T-wave (green), secondary T-wave (blue) and T-wave offset (purple) all as identified semi-automatically.

