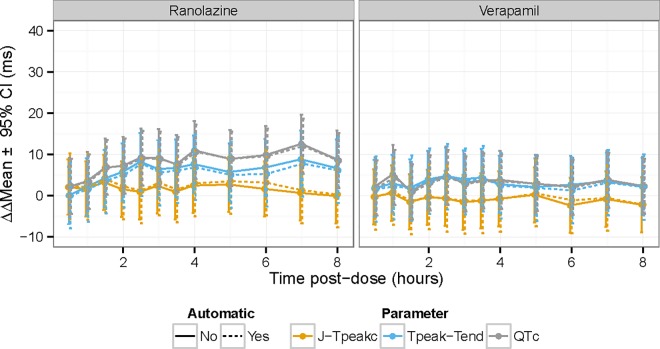
Fig 7. Time profile for ranolazine and verapamil with some time-points removed.
The plots show the time-profile for ranolazine (left) and verapamil (right) for J-Tpeakc (orange), Tpeak-Tend (blue) and QTc (gray) for semi-automated (solid lines) and automated (dashed lines). This is the dame data as Fig 6 with some time points removed to enhance visualization due to crowding of early time-points.

