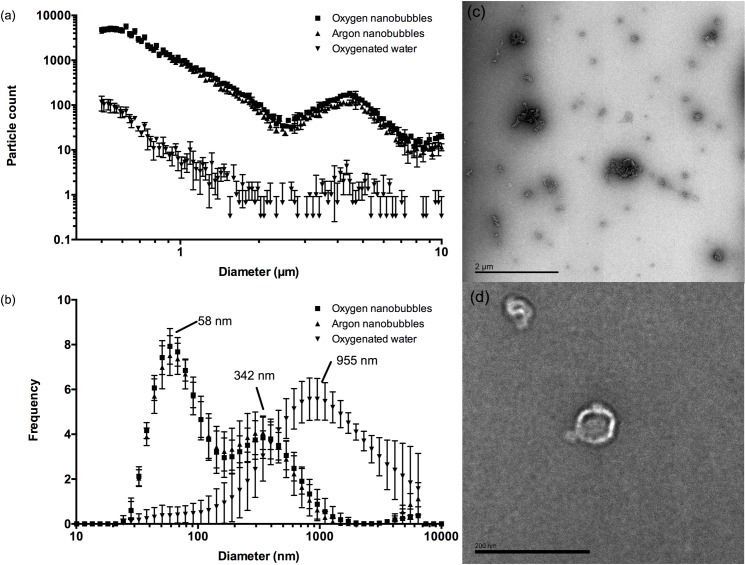
Fig 1.
Mean particle size distributions measured for oxygen nanobubbles, argon nanobubbles and oxygenated water by (a) SPOS and (b) DLS. Error bars indicate the standard deviation in each measurement (n = 9; 3 readings containing 10 runs from 3 samples of each liquid). Panels (c) and (d) show transmission electron micrographs of a sample from the oxygen nanobubble suspension indicating the presence of nanoscale particles (scale bar in (c) is 2 μm, in (d) 200 nm).

