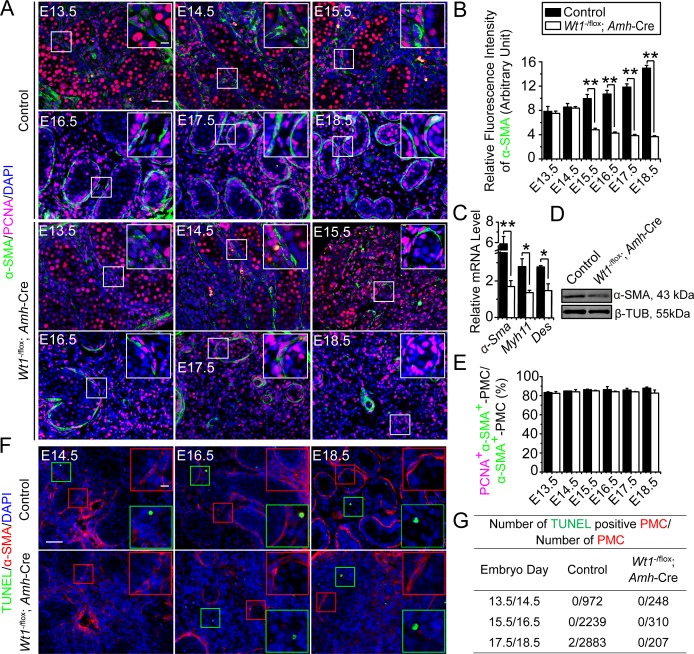
Fig 1. Status of peritubular myoid cells in Wt1SC-cKO testis during fetal mouse testis development.
(A) Immunofluorescence analysis of peritubular myoid cell (PMC) marker α-SMA (FITC, green fluorescence), and proliferation marker PCNA (TRITC, red fluorescence) in cross-sections of control vs. Wt1SC-cKO mouse testes in E13.5 to E18.5. Insets are the corresponding magnified views of the boxed areas. In control testes, α-SMA stained spindle-shaped PMCs. In E13.5 to E15.5 fetal testes, interstitial cells including interstitial progenitor cells were positive for α-SMA. However, the α-SMA expression was strongly up-regulated in PMCs and down-regulated in the interstitial cells in E16.5 to E18.5 fetal testes. The number of PMCs increased during fetal testis cord assembly from E13.5 to E18.5, in addition, most of the α-SMA-positive (α-SMA+) cells were in active cell cycles which were positive for PCNA. In Wt1SC-cKO testes, the number of α-SMA+ cells were down-regulated from E16.5 to E18.5, however, the α-SMA+ cells remained highly proliferative which were positive for PCNA. (B) α-SMA relative fluorescence intensity was used to estimate PMC differentiation status in E13.5 to E18.5 control and Wt1SC-cKO testes. The fluorescence intensity increased in E15.5 to E18.5 in control testes but reduced in Wt1SC-cKO testes, illustrating Wt1 deletion led to a decrease in PMC differentiation. (C) qPCR analysis of PMC marker genes α-Sma, Myh11 and Des in Wt1SC-cKO mouse testes vs. controls in postnatal day 1 (P1). (D) Immunoblot analysis of the PMC-associated protein α-SMA in Wt1SC-cKO mouse testes vs. controls in P1. The steady-state level of α-SMA proteins in P1 mutant testes was significantly down-regulated. (E) Mitotic index expressed as the ratio of PCNA+ and α-SMA+ PMCs to total PMCs (PCNA+ α-SMA+ PMCs:α-SMA+ PMCs). PMC mitotic indexes did not change between control and Wt1SC-cKO testes from E13.5 to E18.5. (F) PMC marker α-SMA (red fluorescence) and apoptotic signals (TUNEL assay) in E14.5 to E18.5 control and Wt1SC-cKO testes were assessed. Insets are the corresponding magnified views of the colored boxed areas. TUNEL+ (green insets) did not overlay with α-SMA+ PMCs in all ages examined (red insets). (G) Effects of Sertoli cell-specific deletion of Wt1 on PMC apoptosis. E, embryonic day; scale bar = 50 μm, and 10 μm in inset, which applies to all micrographs. Each bar is a mean±SEM of n = 3 mice. *, P<0.05; **, P<0.01.

