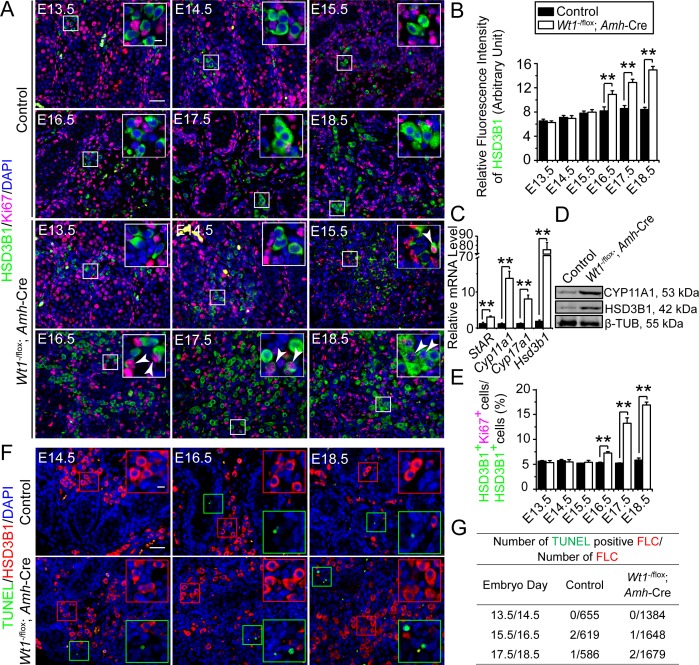
Fig 2. Fetal Leydig cells (FLCs) differentiate, but having abnormal proliferation status in the interstitium of Wt1SC-cKO mouse testes during fetal testis development.
(A) Immunofluorescence analysis of FLC marker HSD3B1 (FITC, green fluorescence) and proliferation marker Ki67 (TRITC, red fluorescence) in cross-sections of control vs. Wt1SC-cKO mouse testes in E13.5 to E18.5. Insets are the corresponding magnified views of the boxed areas. FLCs found in the testicular interstitium were rarely mitotically active in control testes, while in mutant testes FLC density was gradually increased and some FLCs remained mitotically active (white arrowheads) from E16.5 to E18.5. (B) HSD3B1 relative fluorescence intensity was used to estimate FLC differentiation status in E13.5 to E18.5 control and Wt1SC-cKO testes. The fluorescence intensity increased in E13.5 to E16.5 and maintained in E16.5 to E18.5 in control testes but increased in E13.5 to E18.5 in Wt1SC-cKO testes, illustrating Wt1 deletion led to an increase in FLC differentiation. (C) qPCR analysis of FLC marker genes StAR, Cyp11a1, Cyp17a1, Hsd3b1 in Wt1SC-cKO mouse testes vs. controls in P1. (D) Immunoblot analysis of the FLC-associated protein CYP11A1 and HSD3B1 in Wt1SC-cKO mouse testes vs. controls in P1. The steady-state level of CYP11A1 and HSD3B1 proteins in P1 Wt1SC-cKO testes was considerably up-regulated. (E) Mitotic index expressed as the ratio of HSD3B1-positive and Ki67-positive cells to HSD3B1-positive cells (HSD3B1+ Ki67+ cells:HSD3B1+ cells) was used to estimate mitotic activity of FLC in E13.5 to E18.5. FLCs in control testes were less proliferative, however, the mitotic index of FLC in mutant testes was significantly up-regulated from E16.5 to E18.5. (F) FLC marker HSD3B1 (red fluorescence) and apoptotic signals (TUNEL assay) in E14.5 to E18.5 control and Wt1SC-cKO testes were assessed. Insets are the corresponding magnified views of the colored boxed areas. TUNEL+ (green insets) did not overlay with HSD3B1+ cells in all ages examined (red insets). (G) Effects of Sertoli cell-specific deletion of Wt1 on FLC apoptosis. E, embryonic day. Scale bar = 50 μm, and 10 μm in inset, which applies to all micrographs. Each bar is a mean±SEM of n = 3 mice. **, P<0.01.

