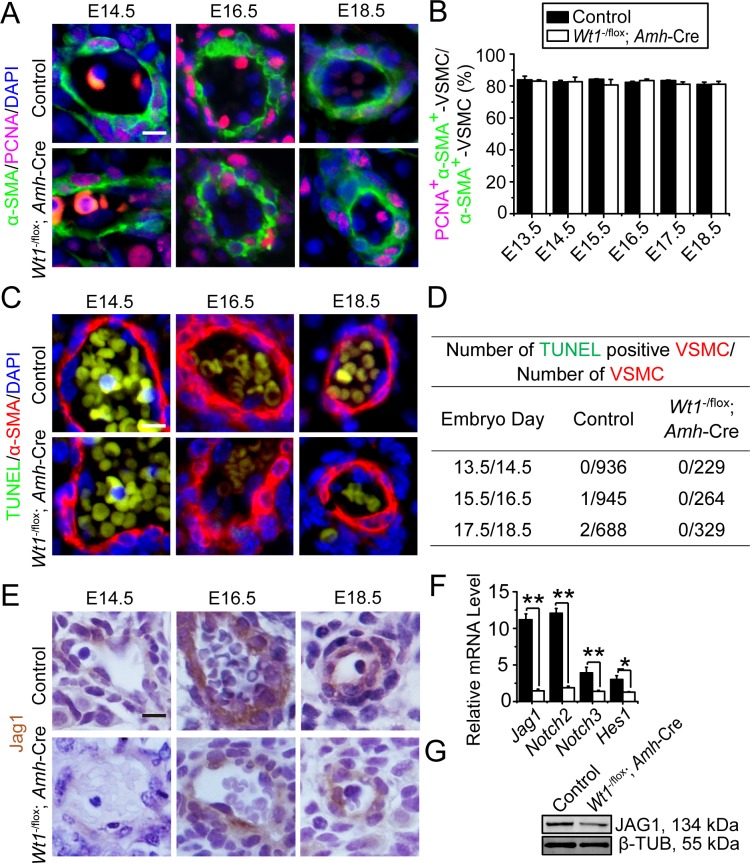
Fig 5. Normal vasculature development but down-regulation of Notch signaling are found in Wt1SC-cKO vs. control testes during fetal testis development.
(A) Immunofluorescence analysis of vascular smooth muscle cell (VSMC) marker α-SMA (FITC, green fluorescence), and proliferation marker PCNA (TRITC, red fluorescence) in cross-sections of control vs. Wt1SC-cKO mouse testes in E14.5, E16.5 and E18.5. Insets are the corresponding magnified views of the boxed areas. VSMCs were normally differentiated and proper vasculature was established in both control and Wt1SC-cKO testes during fetal testis morphogenesis. (B) Mitotic index expressed as the ratio of PCNA+ α-SMA+ VSMCs to total VSMCs (PCNA+ α-SMA+ VSMCs:α-SMA+ VSMCs) was used to estimate mitotic activity of VSMC. VSMC mitotic index did not change between control and Wt1SC-cKO testes from E13.5 to E18.5. (C) VSMC marker α-SMA (red fluorescence) and apoptotic signals (TUNEL assay) in E14.5, E16.5 and E18.5 control and Wt1SC-cKO testes were assessed. Insets are the corresponding magnified views of the colored boxed areas. TUNEL+ (green insets) did not overlay with α-SMA+ VSMCs in all ages examined (red insets). (D) Effects of SC-specific deletion of Wt1 on VSMC apoptosis. (E) Immunohistochemistry analysis of Notch signaling ligand JAG1 in cross-sections of control vs. Wt1SC-cKO mouse testes in E14.5, E16.5 and E18.5. JAG1 was expressed in vasculature-associated interstitial cells in control testes. The JAG1 expression level was down-regulated comparing to corresponding controls in Wt1SC-cKO mouse testes in E14.5, E16.5 and E18.5. (F) qPCR analysis of Notch ligand gene Jag1, receptor genes Notch2, Notch3, target gene Hes1 in Wt1SC-cKO mouse testes vs. controls in P1. (G) Western blot analysis of Notch signaling ligand protein JAG1 in Wt1SC-cKO mouse testes vs. controls in P1. The steady-state levels of JAG1 protein was significantly down-regulated. SE, embryonic day; scale bar = 50 μm, and 10 μm in inset, which applies to all micrographs. Each bar is a mean±SEM of n = 3 mice. *, P<0.05; **, P<0.01.

