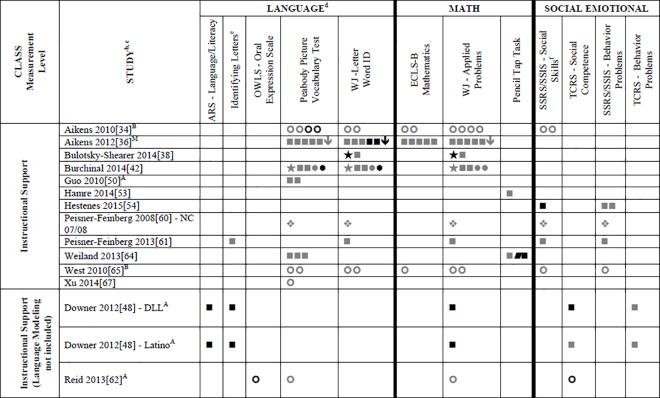
Fig 5. Systematic review of associations between the CLASS domain of Instructional Support and child outcomes.
a Abbreviations: Symbols bolded are significant and positive, symbols bolded and italicized are significant and negative, and symbols in grey are non-significant. Star = Zero Order Pearson’s Correlation, Unfilled circle = Beta, Filled square = Unstandardized Coefficient, Black diamond minus white X = T-Test, Key clover = Partial Correlation, Downward arrow = Effect Size, Filled circle = F-Ratio. aTo improve the readability of this complex table, six papers [46,49,52,55,57,59] that had an outcome that appeared in only one or two samples were omitted from this figure. Several analyses from other papers that had idiosyncratic outcomes were also excluded. For a comprehensive display of all of the data for all of the child outcomes see Tables A-D, S4 File. bThis paper is one of a series of Meta-Analyses and Systematic Reviews assessing the relationship between child care quality and children’s outcomes; therefore, superscript letters below are in reference to various large databases that samples in these papers were drawn from. These letters have been kept consistent across the series of papers for our readers. cSamples within papers are described in more detail in Table 2 in this manuscript. dAcronyms for child outcomes are listed in S5 File. eIdentifying Letters (also referred to as Letter Knowledge, Letter-Naming, Naming Letters).fSSRS/SSIS problem behaviour also includes individual scales: internalizing and externalizing for Hestenes et al., 2015 [54].ANational Center for Early Development and Learning Dataset (NCEDL); BHead Start Family and Children Experiences Survey (FACES 2006 Cohort); MHead Start Family and Children Experiences Survey (FACES, 2009 Cohort).

