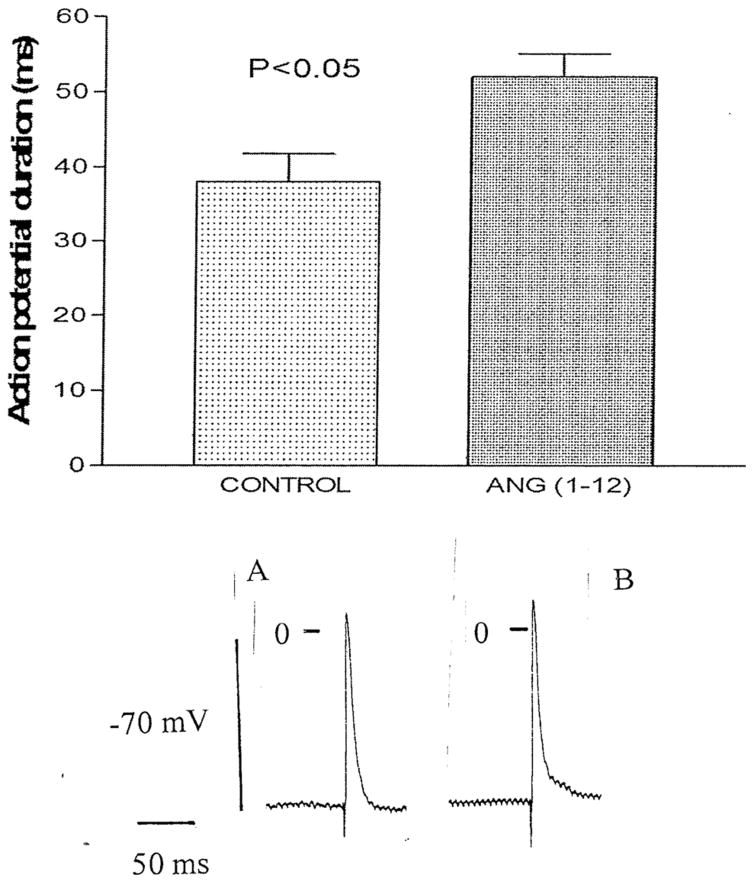
Fig. 2.
Top Influence of intracellular administration of Ang-(1–12) (100 nM) into a myocyte from the intact left ventricle of a WKY rat. Each bar is the average from 24 cells (5 animals). Vertical line at each bar SEM (P < 0.05). Bottom Action potential recoded from a single fiber of the intact left ventricle before and after intracellular injection of Ang-(1–12). Vertical line at each point SEM. Voltage calibration −70 mV; time calibration 50 ms

