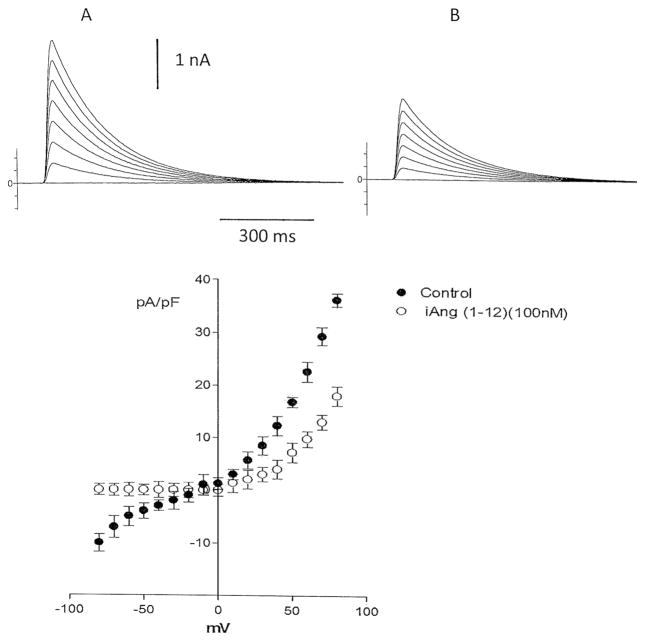
Fig. 6.
Top Influence of intracellular dialysis of Ang-(1–12) (100 nM) on total potassium current recorded from a single isolated cell from the left ventricle before (a) and after 6 min of Ang (1–12) administration (b). Bottom Current–voltage curve showing a decrease of potassium current elicited by the intracellular dialysis of the peptide (100 nM). Each point is the average from 22 cells (4 animals). Vertical line at each point SEM (P < 0.05). Holding potential −80 mV

