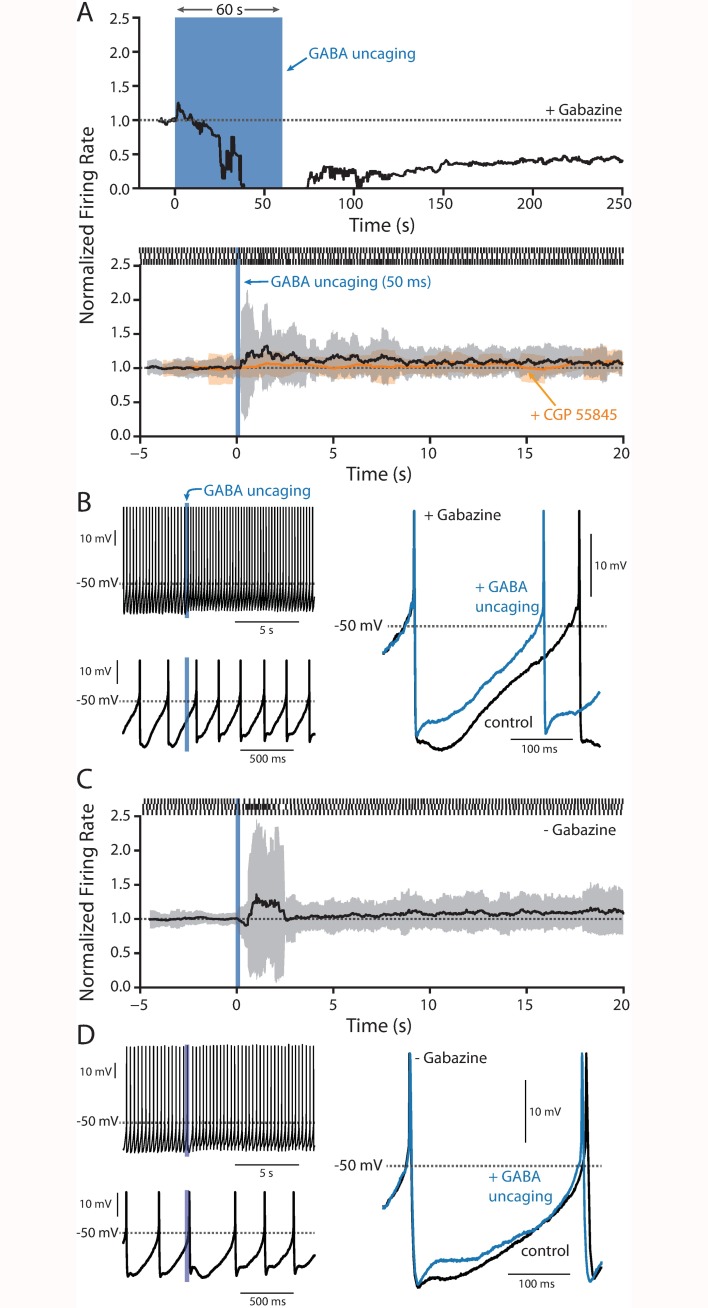
Fig 2. RuBi-GABA uncaging.
(A) Top, plot of the normalized firing rate before during and after a 60 s uncaging pulse (blue bar) of 5 μM RuBi-GABA in the presence of 25 μM gabazine (n = 4). Bottom, plot of normalized firing rate (black line) and running standard deviation (grey area) before, during and after a 50 ms uncaging pulse in the presence of 5 μM RuBi-GABA and 25 μM gabazine (n = 12); application of 2 μM CGP 55845 blunted the changes in spiking induced by RuBi-GABA uncaging (orange line, n = 4). Example raster plots are shown at the top of the panel. (B) Left, two different time scales showing action potentials just prior to and after GABA uncaging. Right, overlaid action potentials from just prior to and after GABA uncaging showing a clear reduction in the mAHP. (C-D) As in panel A (bottom) and B, but in the absence of gabazine (n = 9).

