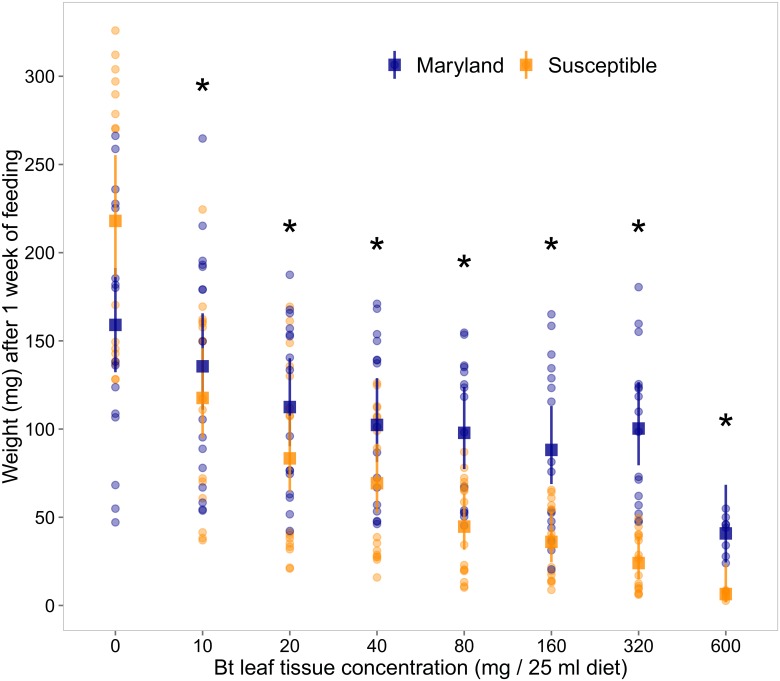
Fig 3. Comparison of weight between susceptible laboratory and field collected Maryland populations of Helicoverpa zea across concentrations of Cry1Ab expressing green leaf tissue.
At every diet concentration other than control (dosage = 0), weight of larvae (mg) after 1 week of feeding assays was significantly higher for the Maryland strain (blue), than the susceptible (orange) strain. Points represent the raw data values; while the squares represent quasi-Poisson GLM estimated means, and the vertical lines denoting the confidence intervals around the mean. Asterisks indicate statistically significant differences (P < 0.05) based on post-hoc comparisons with a Bonferroni correction.

