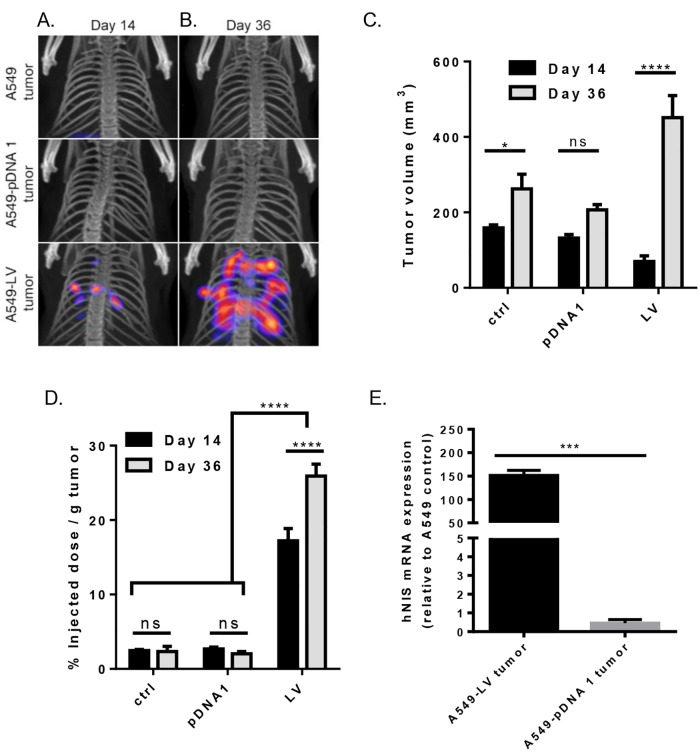
Fig 4. Tumor radioactivity and quantification of orthotopically-injected A549 control tumors, A549-lentiviral vector-hNIS modified tumors, and A549-pDNA vector-hNIS modified tumors.
A & B) Tumor volume quantification by SPECT/CT and 99mTcO4- radioactivity on day 14 (A; respective tumor groups shown horizontally; representative images shown) and day 36 (B; respective tumor groups shown horizontally; representative images shown). C) Tumor growth comparison of A549 control tumors, A549-LV tumors, and A549-pDNA tumors as measured by volume (mm3). D) % injected dose 99mTcO4- per gram lung tumor (%ID/g) after sacrifice. E) mRNA expression of NIS relative to A549 control. A one-way ANOVA with Tukey’s multiple comparison post-test and a two-way ANOVA with Holm-Sidak’s multiple comparison test was used to determine statistical significance,** p < .01; ****p < .0001; data shown with standard error of the mean.

