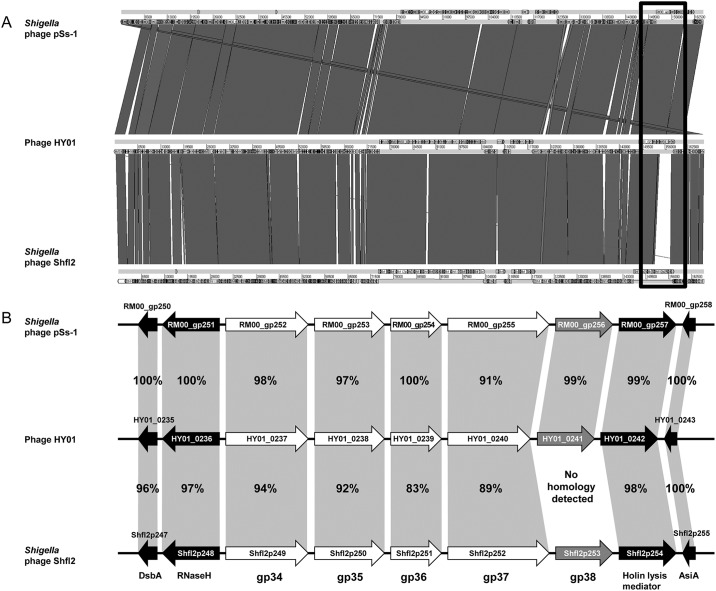
Fig 8. Comparative genomic analysis of phage HY01 with two closely related Shigella phage genomes (pSs-1 and Shfl2).
(A) Whole genome alignment of three phage genomes using ACT13. The yellow open box indicates a small gene cluster with low homology between the HY01 and Shfl2 genomes. (B) Organization of a small gene cluster from the yellow open box. The white arrows indicate long tail fiber-associated genes, the blue arrows indicate receptor recognition genes, and the black arrows indicate genes with other functions.

