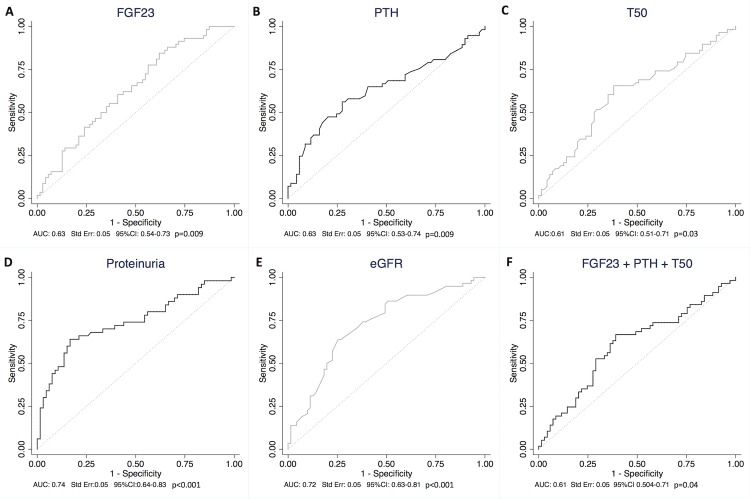
Fig 2. ROC curves of ln FGF23, ln PTH, T50, proteinuria and eGFR in predicting fibrosis ≤20%.
ROC curve analysis of ln FGF23 (Fig 2A), ln PTH (Fig 2B), T50 (Fig 2C), proteinuria (Fig 2D), eGFR (Fig 2E) for the prediction of fibrosis ≤20%. (2F): ROC cuvre analysis of ln FGF23, ln PTH and T50 combined for the prediction of fibrosis ≤20%. As T50 and eGFR are markers that are negatively associated with fibrosis, we used the opposite values of those markers. AUC: Area Under the Curve; eGFR: estimated Glomerular Filtration Rate; FGF23: Fibroblast growth factor 23; Ln: log-transformed; PTH: parathyroid hormone; ROC: Receiver Operating Characteristic; T50: Calcification propensity.

