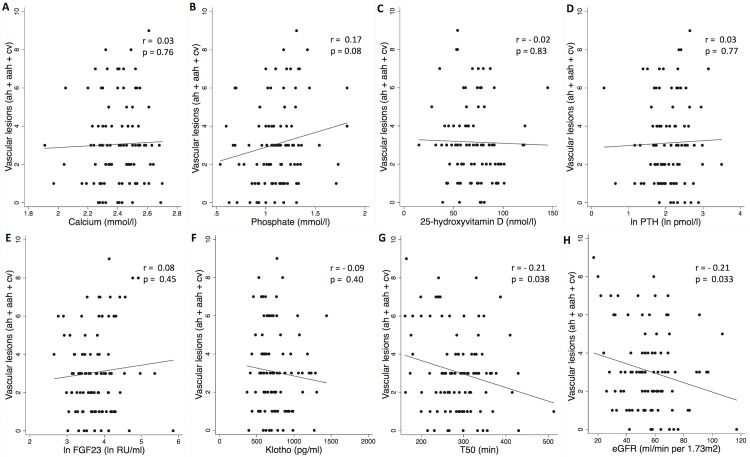
Fig 4. Phosphocalcic biomarkers and T50 associate with chronic vascular lesions as assessed by banff (ah+aah+cv) in renal allograft recipients.
Scatter plot graphs of (A) calcium, (B) phosphate, (C) vitamin D, (D) ln PTH, (E) ln FGF23, (F) Klotho, (G) T50, (H) eGFR versus vascular lesions. Each symbol represents one patient. The continuous line indicates least-square linear regression. Ah: arteriolar hyaline thickening; aah: circumferential hyaline arteriolar thickening; cv: vascular fibrous intimal thickening; eGFR: estimated Glomerular Filtration Rate; Ln: log-transformed; PTH: parathyroid hormone; T50: Calcification propensity.

