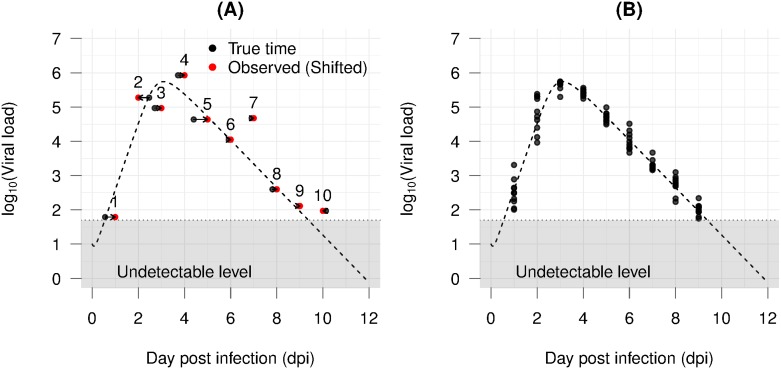
Fig 4. Examples of asynchrony problem.
The dotted curve is the true kinetics, dots are data points. (A) Ten subjects with measurement error and asynchrony; red points are the observed data; black points are the actual time the measurement should have represented; arrows indicate directions of time shift; (B) Generated asynchrony data in the absence of measurement error.

