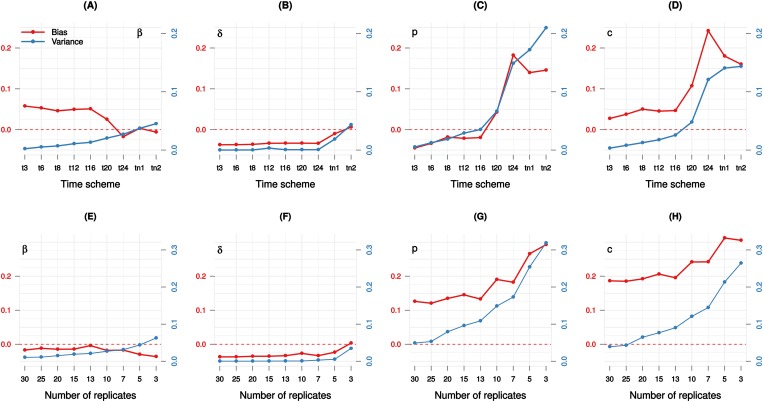
Fig 5. Sampling time scheme and parameter bias-variance.
Top: t3 to t24 indicate regular sampling time in every 3 to 24 hours respectively; tn1 indicates sampling time similar to that of [11]; tn2 is t24 without measurement at the peak day (3rd) and the endpoint (8th). Ten replicates were generated per time point. Each scenario (point) is the result of 1000 simulations. Bottom: The every day sampling scheme (t24) is used.

