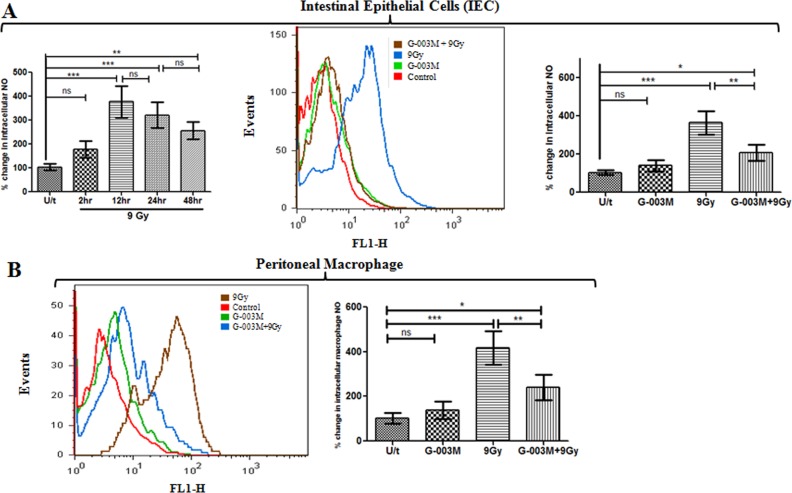
Fig 5. G-003M blocked nitric oxide (NO) generation in intestinal epithelial cells (IEC) and peritoneal macrophages.
(A) Flow cytometry histogram showing changes in NO levels in IEC of mice (n = 3) that were left untreated (U/t), G-003M alone, exposed to 9 Gy TBI 60 min after injection of DMSO (9 Gy) or G-003M (G-003M+9Gy). Bar diagram showing % change in intracellular NO production at different time intervals post irradiation compared to untreated mice and in different treatment groups is also shown. (B) Depicts NO levels in peritoneal macrophages after exposure to 9 Gy TBI with or without G-003M treatment. Quantification of NO level is presented as percent change in mean fluorescence intensity of different treatment groups. Cells from untreated mice were used as controls. All the figures are representative results of three independent experiments and expressed as mean±SD. A value of p<0.05 is considered statistically significant. ns = nonsignificant, * = p < 0.05, ** = p < 0.01, *** = p < 0.001.

