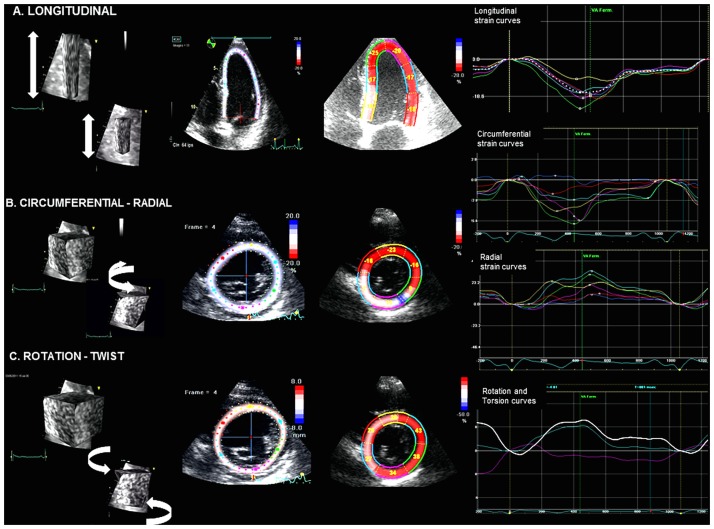
Fig 3. Speckle Tracking Echocardiography (Illustrative Figure).
Patient with first inferior STEMI in acute phase STE with peak systolic strain measurements by GE Vivid EchoPAC software: (A) apical 4 chamber view with longitudinal strain calculation, (B) parasternal short axis view with circumferential (CS), radial strain (RS), and (C) LV twist calculation based on rotation values. The left panels show the direction (arrows) in which the various strain parameters are being measured. The middle panels demonstrate the region of interest and segmental strain values (except for circumferential strain) while the right panels illustrate the regional strain curves.

