
Fig 1. Transcripts of poorly expressing membrane proteins accumulate in immobile polar foci.
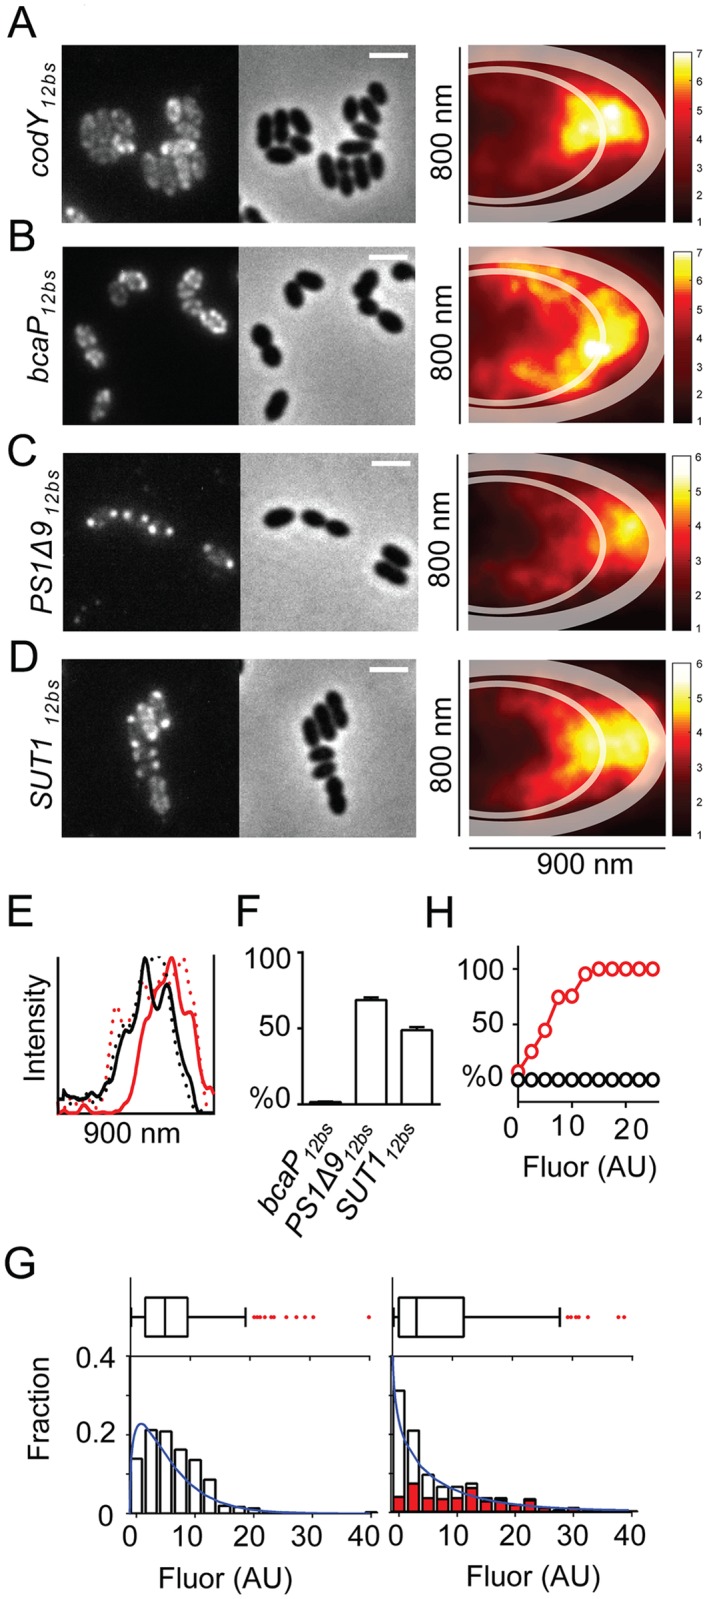
(A-D) Left panels: Localization of codY12bs, bcaP12bs, PS1Δ912bs or SUT112bs transcripts in L. lactis NZ9000 cells. Center panels: Corresponding phase contrast images. Scale bar = 2 μm. Colored panels: Location maps constructed from fluorescent TAMRA spots observed in 1185, 877, 765, and 661 cells, respectively, highlighting the preferential localization of each overexpressed mRNA in one half of a model cell. Thick transparent lines: Cell boundaries including the portion occupied by cell wall and membrane as approximated using BcaP-GFP expressing cells (See S1C Fig). Thin transparent lines: Boundaries of chromosomal areas as approximated using DAPI staining in living cells (See S1C Fig). Scale bars depict the relative density of each mRNA species. (E) Intensity profiles drawn along the center of the X-axis of the location maps ((A-D), colored panels) of cells expressing bcaP12bs (solid black line), codY12bs (dotted black line), PS1Δ912bs (solid red line) or SUT112bs (dotted red line). (F) The percentage of cells with bcaP12bs, PS1Δ912bs, or SUT112bs polar mRNA clusters. Error bars: Standard errors. (G) The population-wide distribution of bcaP12bs or PS1Δ912bs mRNA content obtained from single-cell measurements depicted in box plots and histograms (lower panels). Red bars (right panel): The fraction of cells with polar PS1Δ912b mRNA clusters. Blue lines: Gamma distributions fitted to expression data. Fluor = fluorescence. (H) The percentage of cells containing polar bcaP12bs (black) or PS1Δ912bs (red) mRNA clusters plotted as a function of intracellular TAMRA levels (corresponding to bcaP12bs or PS1Δ912bs mRNA levels).