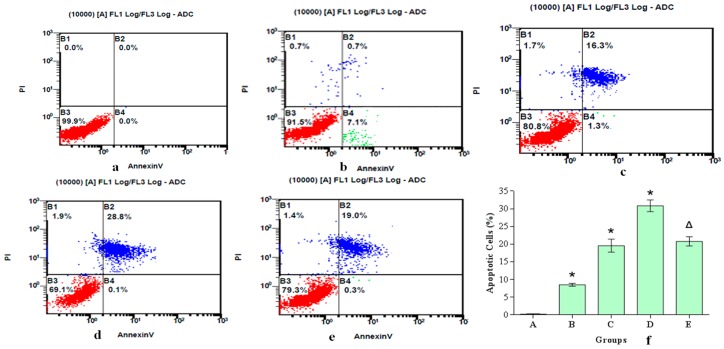
Figure 6.
Apoptosis of hepatocytes exposed to 0, 2.50, 5.0 or 10.0 μg/mL aniline for 24 h. Cells were treated with aniline, then stained with fluorescein isothiocyanate-conjugated Annexin V and propidium iodide using flow cytometry. (a) 0 μg/mL; (b) 2.50 μg/mL; (c) 5.0 μg/mL; (d) 10.0 μg/mL; (e) 10.0 μg/mL + 20 mmol/L NAC; (f) Apoptotic cells (%). Data represented are mean ± SD of three identical experiments made in triplicate. * Compared with control, p < 0.05; Δ compared with 10.0 μg/mL group, p < 0.05.

