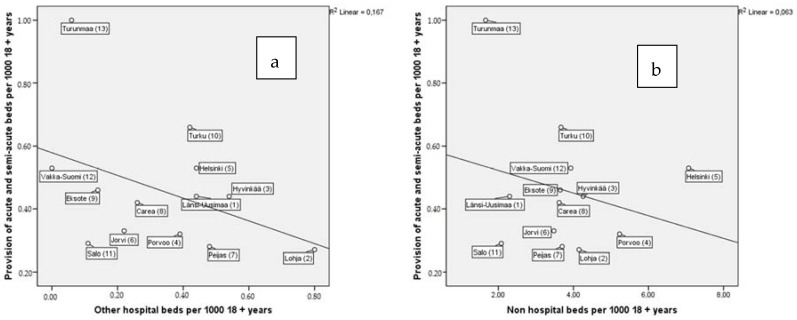
Figure 3.
Associations between acute- and semi-acute (time-limited) inpatient treatment provision and; (a) other hospital bed- and (b) non-hospital bed- provision per 1000 adults (18+). The numbers in brackets after catchment areas indicate the data collection order and were used in a previous article [20].

