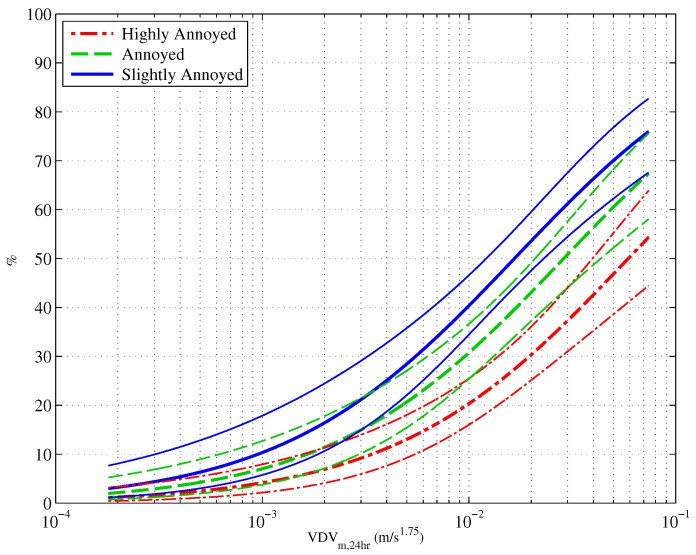
Figure 3.
Exposure-response curves showing the proportion of people who are highly annoyed, annoyed and slightly annoyed by construction vibration. The dashed lines represent 95% confidence intervals. This figure is reproduced with permission from [7].

