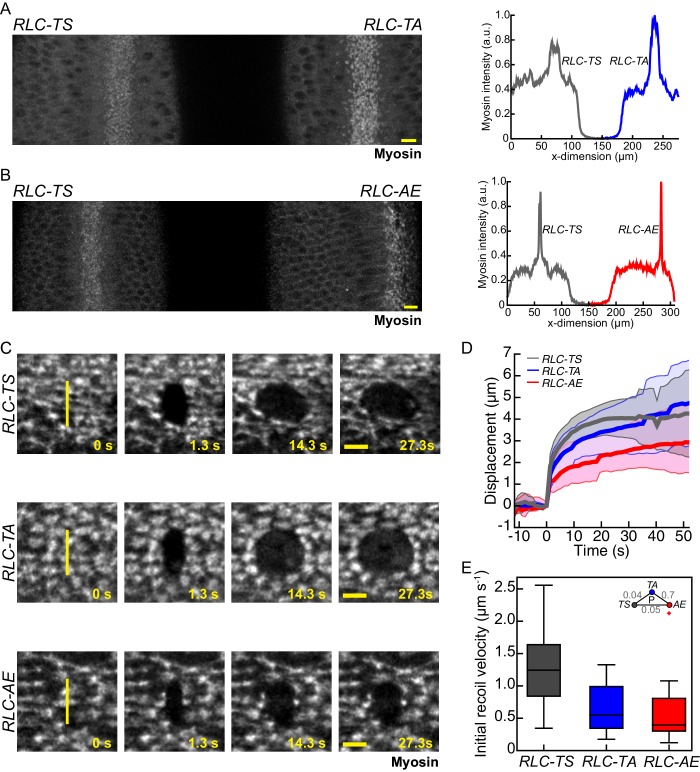
Figure 3. Myosin mutants with reduced motor activity exhibit reduced tissue recoil following laser ablation.
(A–B) Myosin intensity in pair of embryos expressing RLC-TS and RLC-TA (A) or RLC-TS and RLC-AE (B) are comparable. The images represent embryos mounted side-by-side and imaged at the same time to compare myosin intensity under identical imaging conditions. Plots (right) show the peak mean intensity profile of myosin signal along a horizontal line spanning each embryo. Scale bars = 10 µm. (C) Initial wound recoil is less pronounced in tissues expressing RLC mutants than in RLC-TS tissue. Time-lapse images of embryos expressing indicated RLC mutant. Between time 0 s and 1.3 s an 8.5 μm incision in the tissue was made, indicated by the vertical yellow line. Scale bars = 5 µm. (D) Mean displacement of wound edge following tissue ablation (n = 15 RLC-TS embryos, n = 11 RLC-TA embryos, n = 10 RLC-AE embryos). Shaded area is +/− one standard deviation. (E) Initial recoil velocity is higher in RLC-TS tissue. The initial recoil velocity was calculated by fitting the displacement to a Kelvin-Voigt model and taking the derivative of the fit at time zero. Central line in box plot is the median, the box edges are the 25th and 75th percentiles, and the whiskers represent the distribution minima and maxima (n = 14 RLC-TS embryos, n = 10 RLC-TA embryos, n = 9 RLC-AE embryos).


