. 2016 Dec 3;5:e20718. doi: 10.7554/eLife.20718

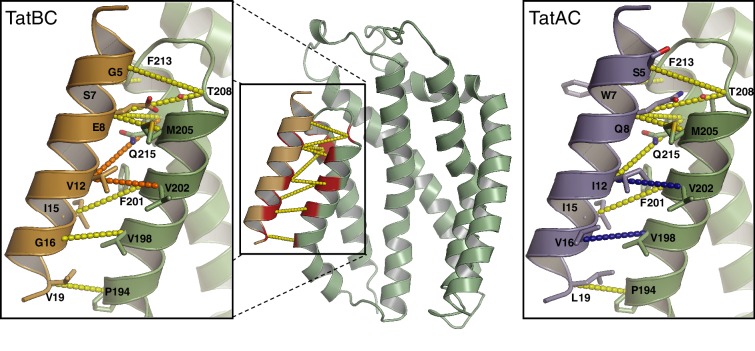
Figure 3. Modeling the interaction of TatA and TatB with the C-terminal end of TatC.

The interaction between the TatA/B TMH and TatC TM5/TM6 modeled for E. coli TatBC and TatAC pairs. The models are based on A. aeolicus TatC crystal packing contacts. Evolutionary couplings for the TatAAll dataset are shown (dotted lines). Couplings retained in just the TatB or TatA datasets with precisions greater than 0.5 (Figure 3—figure supplement 1A) are colored orange or blue, respectively. See also (Table 1).

DOI: http://dx.doi.org/10.7554/eLife.20718.006

Figure 3.

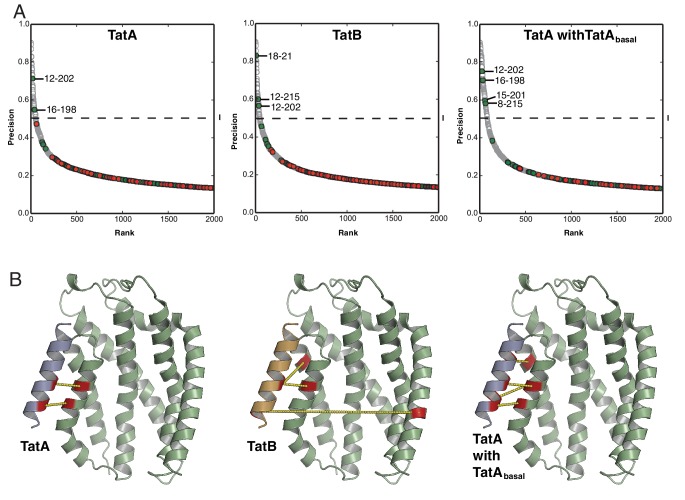
Figure 3—figure supplement 1. Co-evolution analysis of inter-subunit contacts in the Tat system.

Figure 3—figure supplement 1.

(A) Co-evolution data for TatA subsets with TatC, predicted using PSICOV (Jones et al., 2012). The TatA and TatB subsets were defined phylogenetically as shown in Figure 2A. The comparison using the TatAbasal dataset alone did not identify significant co-variances due to the limited number of sequences in the dataset. However, combining the TatAbasal dataset with the TatA dataset recovered more of the TMH-TatC TM5/TM6 covariances seen with the TatAall dataset than using the TatA dataset alone. This suggests that TatAbasal also binds at this site. Combining the TatAbasal dataset with the TatB dataset did not change the set of high-scoring co-varying pairs recovered with the TatB dataset alone. A cut-off of 0.5 precision (dashed line) is used for increased confidence in the predicted residue pairs. (B) Inter-subunit contacts above 0.5 precision are depicted (yellow dashed lines) on the TatA/B TMH-TatC complex models derived in Figure 3.