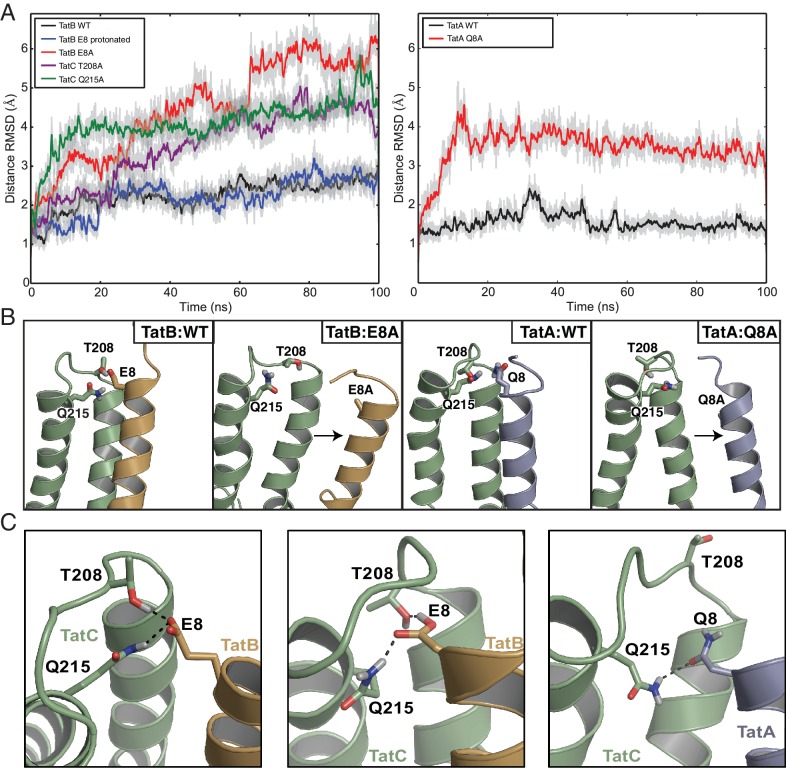
Figure 4. Molecular simulations of the interactions of TatA and TatB with the C-terminal end of TatC.
(A) Root-mean square deviation (RMSD) of the distances between predicted contact pairs during atomistic MD simulations of the indicated TatBC (left) and TatAC (right) models in a membrane environment taken from three simulations. Both raw data (light gray) and data averaged over a rolling window of 0.35 ns (bold) are shown. Except where indicated, TatB E8 was deprotonated in the simulations. (B) Alanine substitution of the TMH polar residue disrupts the interaction between TatC and the TMHs of TatB (orange) or TatA (blue). The output structures from 100 ns MD simulations are shown with the helix displacements seen in the variants (right hand panel in each pair) relative to the wild-type proteins (left hand panel in each pair) denoted by arrows. (C) Snapshots of the MD simulations of the TatBC and TatAC models showing hydrogen bonding interactions between residues in the inter-subunit polar cluster. Simulations were run with TatB E8 either deprotonated (left panel) or protonated (center panel). See also Videos 1–2.


