. 2016 Dec 3;5:e20718. doi: 10.7554/eLife.20718

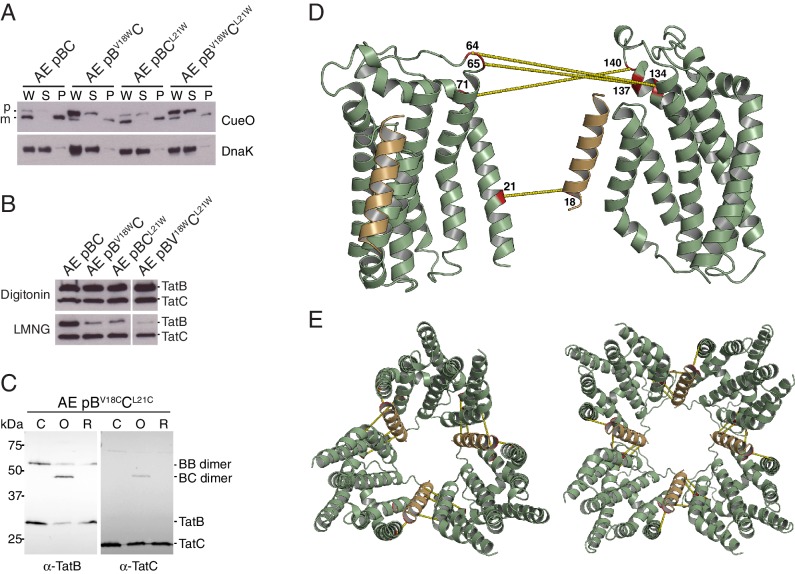
Figure 8. Identification of a second TatBTMH-TatC contact site.

(A) Tat transport activity of strains with tryptophan substitutions targeting the predicted interface between the TatB TMH and TatC TM1. Methodology and labels are as for Figure 5A. (B) Effects of the tryptophan substitutions on TatBC interactions. Cell lysates were solubilized in either digitonin (top panel) or LMNG (bottom panel), immunoprecipitated with antibodies against TatC, and then immunoblotted with a combination of TatB and TatC antibodies. (C) Disulfide crosslinks can be detected at the predicted interface between the TatB TMH and TatC TM1. Cells carrying the indicated cysteine substituted Tat variants were subjected to a mock incubation (‘C’, no oxidant or reductant), oxidizing (‘O’, copper phenanthroline) or reducing (‘R’, DTT) conditions. Membranes were then isolated and subjected to immunoblotting with TatB (left panels) or TatC (right panels) antibodies. (D) Structural representation of the highest-scoring co-evolution-predicted contacts between TatBTMHC heterodimers (precision >0.6). (E) Model for the TatBC complex based on docking either three (Left) of four (Right) TatBTMH-TatC heterodimers to optimize agreement with the co-evolution data in (D). The complexes are viewed from the cytoplasmic side of the membrane. See also Figure 8—figure supplement 3, Video 3 and Supplementary files 1 and 2.

DOI: http://dx.doi.org/10.7554/eLife.20718.017

Figure 8.

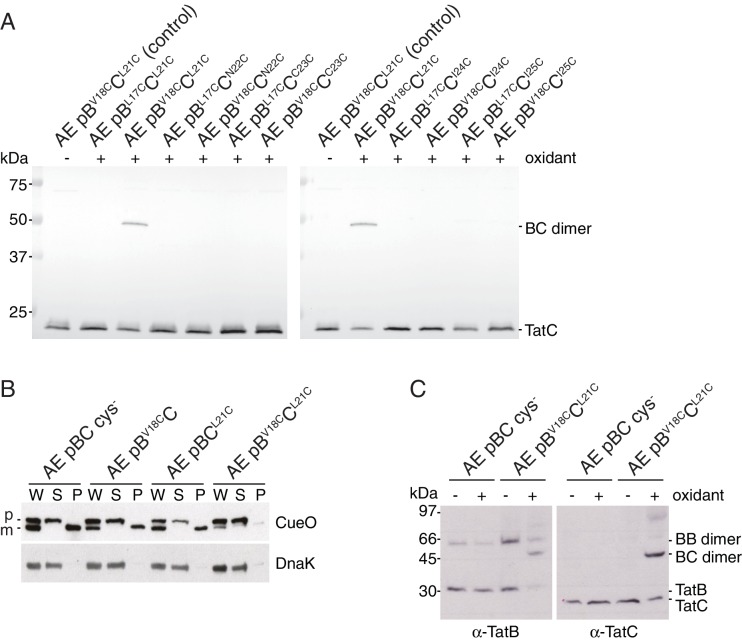
Figure 8—figure supplement 1. TatB V18C and TatC L21C substitutions permit crosslinking of TatB to TatC and impair transport activity.

Figure 8—figure supplement 1.

(A) The indicated strains were subjected to control (no oxidant) or oxidizing (1.8 mM copper phenantrholine) conditions. Membranes were then isolated and subjected to immunoblotting with TatC antibodies. (B) Transport activity of strains overproducing the Tat substrate CueO. Whole cell (W), periplasm (P), and spheroplast (S) fractions were subject to immunoblotting with antibodies against CueO (top panel) or the cytoplasmic marker protein DnaK (bottom panel). m is the transported, signal peptide-cleaved form of CueO, and p the precursor protein. (C) The cultures used in (B) were subjected to control (no oxidant) or oxidizing (0.9 mM copper phenanthroline) conditions. Membranes were isolated and subjected to immunoblotting with TatB (left panel) or TatC (right panel) antibodies.
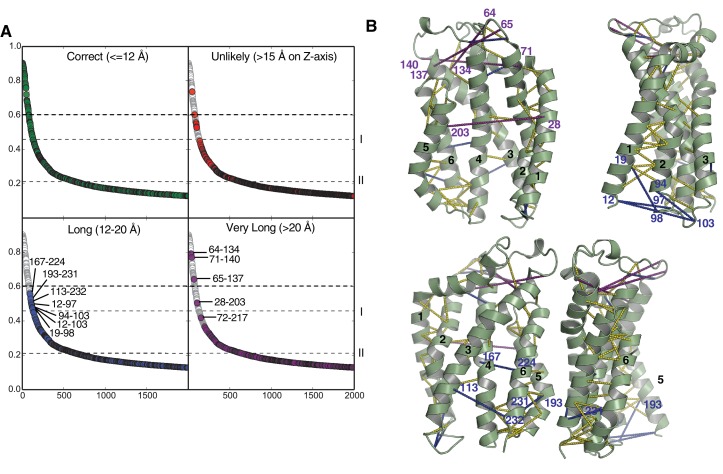
Figure 8—figure supplement 2. Evolutionary contacts predicted by PSICOV for TatC.

Figure 8—figure supplement 2.

(A) Predicted TatC-TatC contacts from the analysis in Figure 1B were mapped on to the modeled structure of E. coli TatC and then sorted by the distance between the Cα-atoms of the interacting residues. Contacts within 12 Å were considered to be consistent with the crystal structure of TatC (green). Contacts with a separation of greater than 15 Å across the membrane (direction of the z-axis) were deemed to be spurious under any model (red). Contacts with separations between 12 and 20 Å may indicate contacts in alternative conformational states (blue). Contacts with separations over 20 Å are candidates for inter-subunit contacts within the TatBC multimer (purple). Dashed line I marks the co-variance score that is 7SD above the mean for the full contact dataset shown in Figure 1B. Dashed line II marks the co-variance score that is 6SD above the mean for the inter-subunit contacts shown in Figure 1B. See also Table 1. (B) Four orthogonal views of the TatC protein showing predicted TatC-TatC contacts above the 7SD significance level (dotted lines). Plotted are all contacts (yellow), contacts with separations between 12 and 20 Å (blue), and contacts with separations over 20 Å (purple). Contacts with separations between 12 and 20 Å cluster at the cytoplasmic face of the membrane and include residues known to be involved in signal peptide binding (H12, F94, and E103, E. coli TatC numbering). These putative contacts may, therefore, characterize a TatC conformer that is reached after substrate binding.
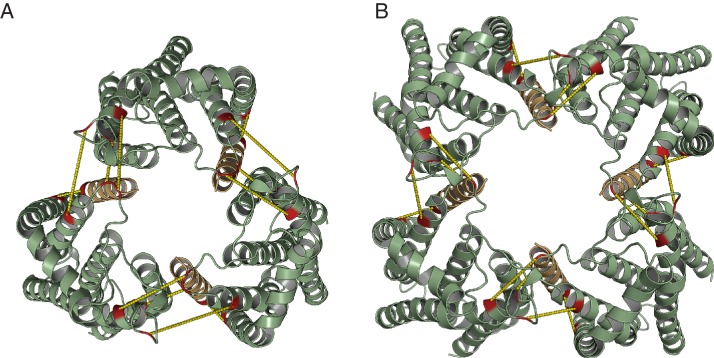
Figure 8—figure supplement 3. Model for the TatBC complex based on docking either (A) three or (B) four TatBTMH-TatC heterodimers to optimize agreement with the co-evolution data in Figure 8D.

Figure 8—figure supplement 3.

The complex is viewed from the periplasmic side of the membrane.
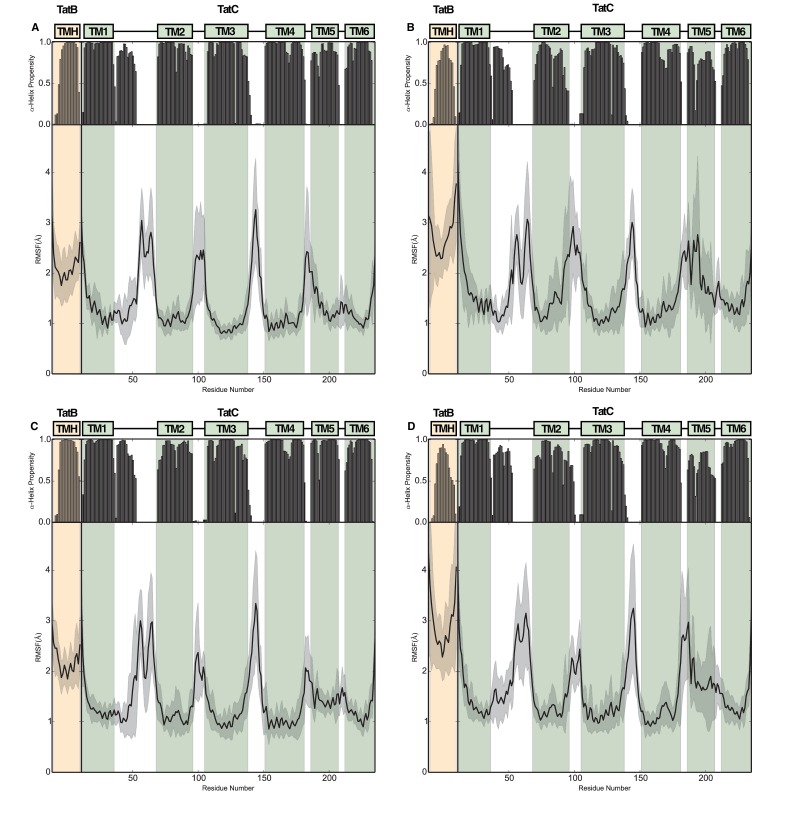
Figure 8—figure supplement 4. Structural stability plots for the modeled trimeric and tetrameric Tat protein complexes from molecular simulations.

Figure 8—figure supplement 4.

(A) The (TatBC)3 complex with lipids in the central pore, (B) the (TatBC)3 complex with water in the central pore, (C) the (TatBC)4 complex with lipids in the central pore, and (D) the (TatBC) 4 complex with water in the central pore.