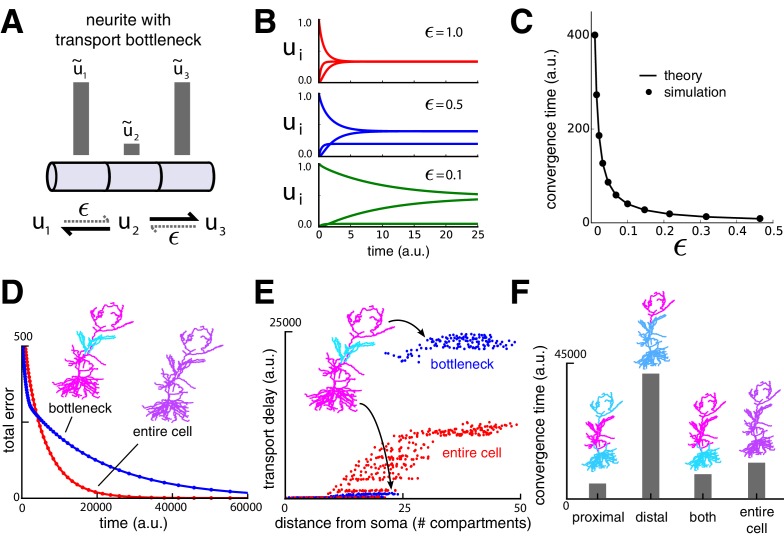
Figure 3. Transport bottlenecks caused by cargo demand profiles.
(A) A three-compartment transport model, with the middle compartment generating a bottleneck. The vertical bars represent the desired steady-state concentration of cargo in each compartment. The rate of transport into the middle compartment is small (, dashed arrows) relative to transport out of the middle compartment. (B) Convergence of cargo concentration in all compartments of model in (A) for decreasing relative bottleneck flow rate, . (C) Simulations (black dots) confirm that the time to convergence is given by the smallest non-zero eigenvalue of the system (solid curve). (D) Convergence to a uniform demand distribution (red line) is faster than a target distribution containing a bottleneck (blue line) in the CA1 model. Total error is the sum of the absolute difference in concentration from demand ( norm). Neuron morphologies are color-coded according to steady state cargo concentration. (E) Transport delay for each compartment in the CA1 model (time to accumulate 0.001 units of cargo). (F) Bar plot comparison of the convergence times for different spatial demand distributions in the CA1 model (steady-state indicated in color plots). The timescale for all simulations in the CA1 model was normalized by setting for each compartment.

