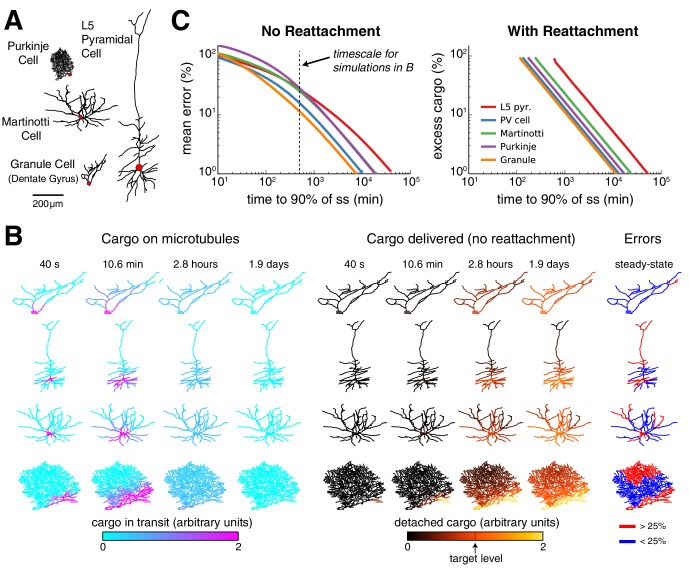
Figure 8. Effect of morphology on trafficking tradeoffs.
(A) Representative morphologies from four neuron types, drawn to scale. The red dot denotes the position of the soma (not to scale). (B) Distribution of cargo on the microtubles () and delivered cargo () at four time points for sushi-belt model with irreversible detachment. Cargo originated in the soma and was transported to a uniform distribution (all , normalized to a diffusion coefficient of 10 μm2 s-1); the detachment rate was spatially uniform and equal to 8 × 10⁻⁵ s−1. (C) Tradeoff curves for achieving a uniform distribution of cargo in realistic morphologies (PV cell = parvalbumin interneuron, morphology not shown). The sushi-belt model without reattachment (as introduced in Figure 4) suffers a tradeoff in speed and accuracy, while including reattachment (as in Figure 7) produces a similar tradeoff between speed and excess ‘left-over’ cargo. An optimistic diffusion coefficient of 10 μm2 s−1 was used in both cases. For simulations with reattachment, the detachment rate () was set equal to trafficking rates () for a one micron compartment. The dashed line denotes the convergence timescale for all simulations in panel B.

