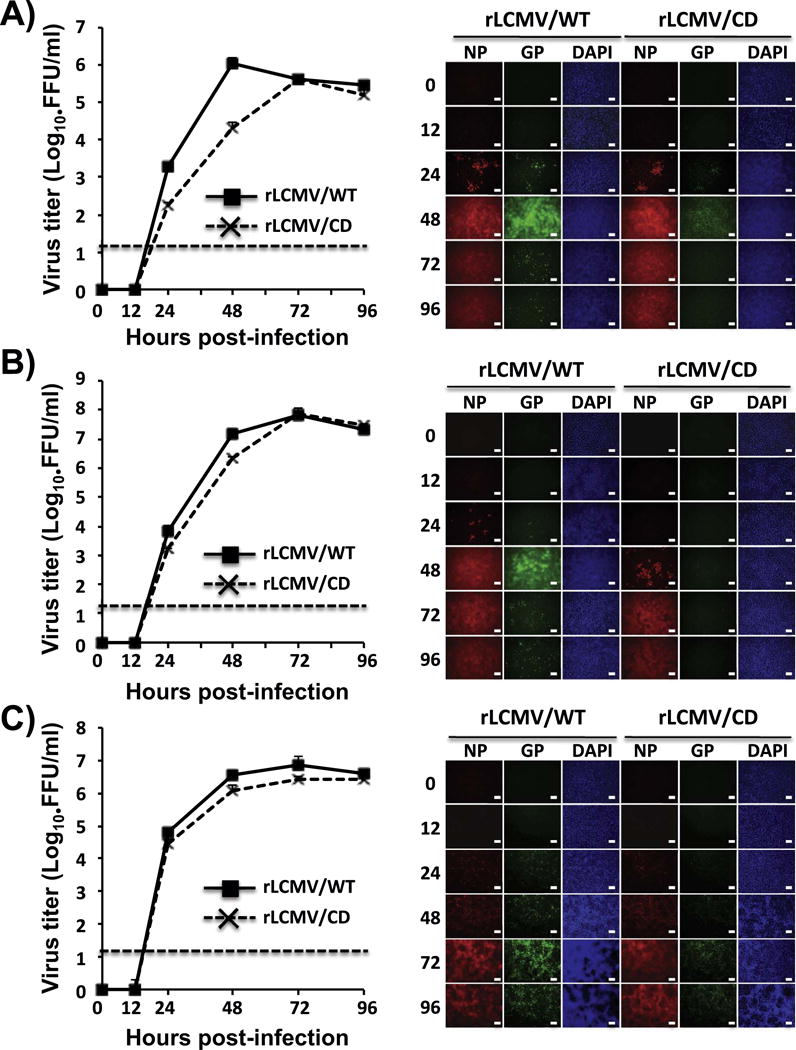
Fig. 3.

rLCMV/CD growth kinetics in cultured cells. A549 (A), BHK-21 (B), and Vero (C) cells (triplicates) were infected (moi=0.01) with either rLCMV/WT or rLCMV/CD. Viral titers in TCS at the indicated h. p.i were determined by immune-focus assay (FFU/ml) (left). Dotted line indicates the limit of detection (20 FFU/ml). Replicates of cells infected as before were evaluated for NP and GP expression levels by IFA assay (right) using the LCMV GP and NP mouse monoclonal antibodies 83.6 and 1.1.3, respectively. DAPI was used for nuclear staining. Representative images of three independent infection experiments are illustrated. Scale bar=100 μm.
