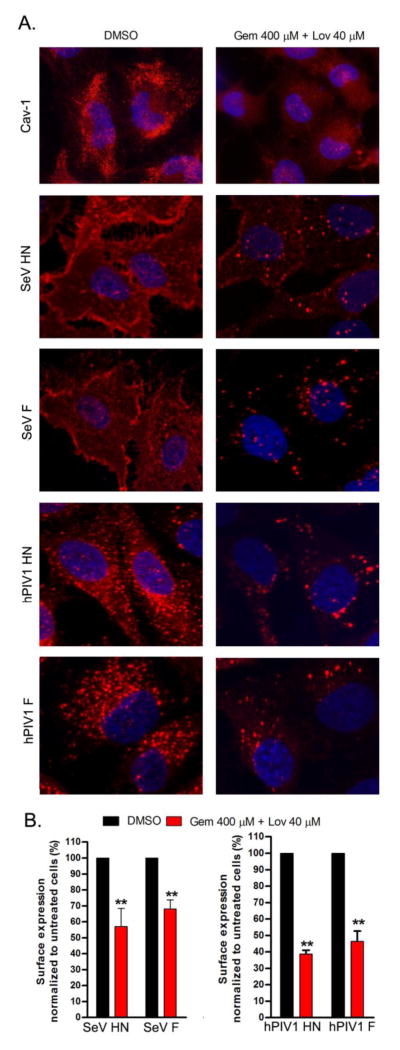
Figure 6.
Reduced expression of viral glycoproteins at the surface of drug-treated cells. (A) Cells untreated or treated with drugs were infected or mock infected (for the detection of cav-1), and analyzed for surface distribution of cav-1 and viral HN and F expression. Fixed and unpermeabilized cells were utilized for IF analysis to detect indicated proteins. (B) The amounts of viral glycoproteins at the surface of infected cells were quantitated by ELISA. (n=3). **; P<0.01 (student t test).

