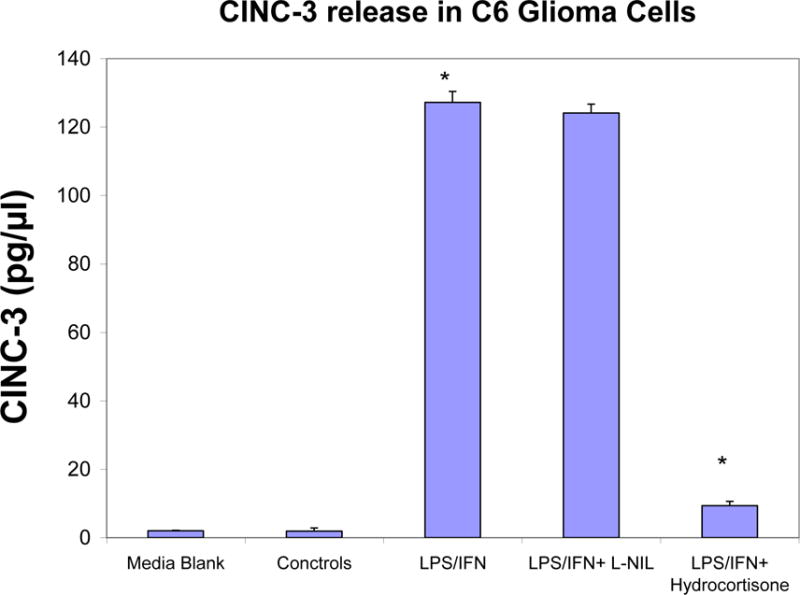
Figure 2D.

ELISA quantification of CINC-3 released in supernatant by LPS/IFNγ treated C6 glioma cells at 24 hours ± selective iNOS inhibitor: L-NIL (20μg/ml) and hydrocortisone (20μg/ml). The data represent CINC-3 (pg/μl) and expressed as the Mean ± S. E. M., n=3. Differences between resting and LPS/IFNγ activated cells were determined by a Student’s t-test (*) P<.001, and LPS/IFNγ vs. L-NIL and hydrocortisone treated cells (*) P<.001.
