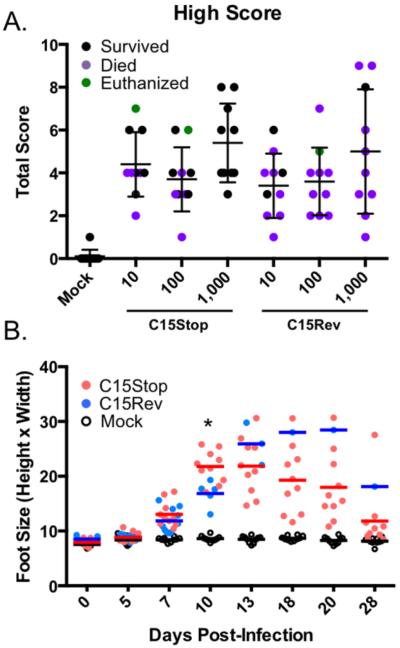
Fig. 3.
Effect of virus dose on disease symptoms. (A) Animals from Fig. 2 were scored for disease symptoms daily following infection. Movement and condition of the coat, eyes and limb each contributed to the scores. The highest total score achieved at any time during disease course by each animal was plotted with those animals who survived shown in black; animals that subsequently died or were euthanized are shown in purple and green, respectively. The bars represent the mean score and one standard deviation above and below. (B) Animals mock-infected or infected with 1,000 PFU of C15Stop or C15Rev were from the experiments used in Fig. 2. Footpad swelling was determined twice weekly by measuring the width and height of swelling and the size was calculated by multiplying these values. On day 13 only three C15Rev animals remained and on day 18 only one C15Rev animal remained. All five C15Stop animals survived. Bars represent the median values. On day 10 swelling was significantly (Mann-Whitney, *p = 0.0127) greater in the C15Stop animals than in C15Rev animals.

