Figure 2.

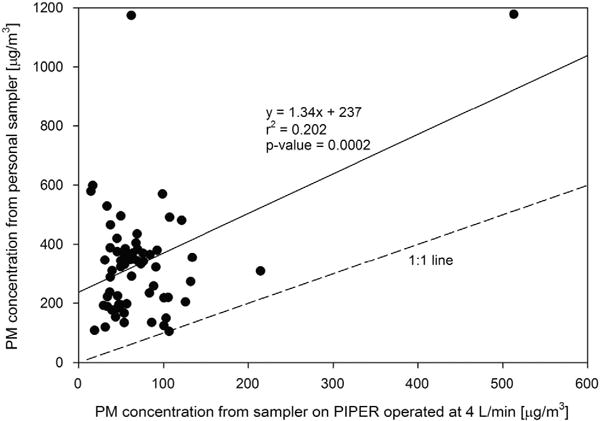
Correlation of PM concentration values from sampler on PIPER operated at 4 l/min (x axis) and personal sampler on backpack (y axis). For reference, a 1:1 line is shown along with the line of best fit.

Correlation of PM concentration values from sampler on PIPER operated at 4 l/min (x axis) and personal sampler on backpack (y axis). For reference, a 1:1 line is shown along with the line of best fit.