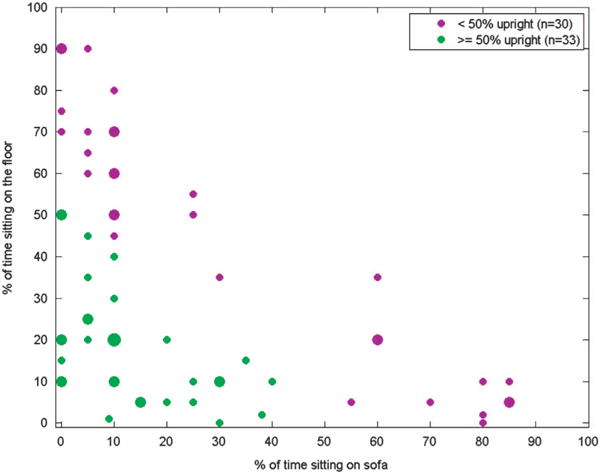
Figure 3.

Estimated percent of time that children spent upright, sitting on the floor, and sitting on the sofa. The smallest circles indicate that one child matched a particular distribution. The largest circle (10% of time on sofa, 20% of time on floor, and 70% upright) represents four children with that particular distribution of activities; all other circles represent two children.
