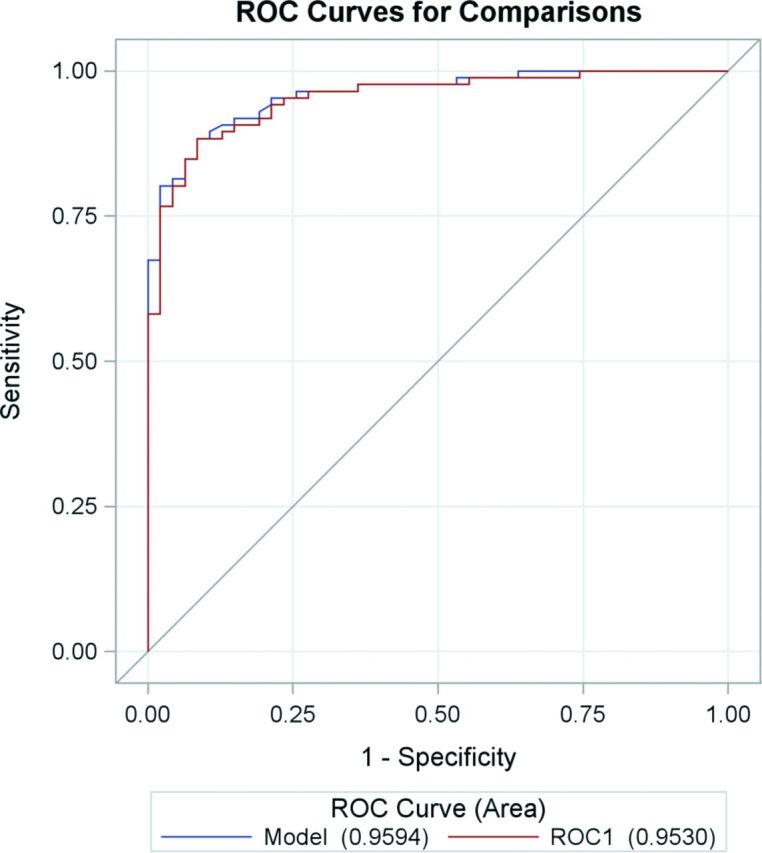
Fig 3.

Receiver operator characteristic curves for susceptibility relative to normal-appearing white matter to predict lesion-enhancing status. The area under the curve is 0.9594 from bootstrapped model and 0.9530 from the jackknife cross-validated ROC1.
