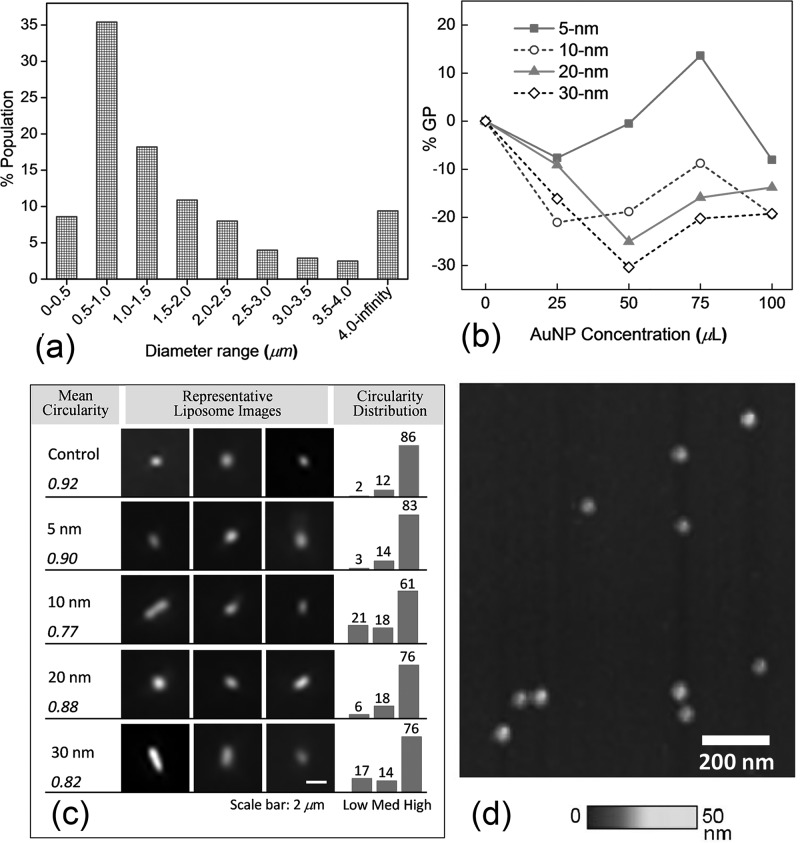
FIG. 2.
(a) Size distribution of as-prepared liposomes from fluorescence image analysis. (b) Percent changes in generalized polarization (% GP) of control liposomes vs. treatment of various sizes and concentrations of AuNPs. (c) Representative fluorescence images of liposomes under various AuNP treatment (center). The mean values of circularity (left). The histograms of percent populations for low (0–0.5), medium (0.5–0.8), and high (0.8–1) circularities (right). (d) Size uniformity of 20-nm AuNPs imaged by QNM AFM.

