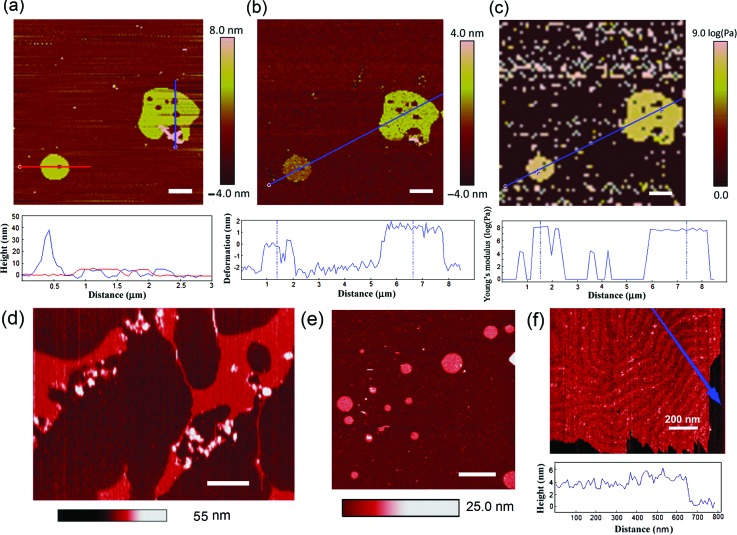
FIG. 3.
(a) The AFM height image of supported DMPC bilayers incubated with AuNPs and imaged under 1× PBS at low QNM force of 3.3 nN. The height profiles along two section lines across the big (blue) and small (red) bilayer patches respectively are shown below. (b) The AFM mapping of bilayer deformation under 1× PBS at medium QNM force of 6.6 nN and the deformation profile along the section line. (c) Strain-dependent elastic modulus map and the section profile at low QNM force at 0.33–1.5 nN. (d) AFM topographic images of DMPC bilayer disruption by high concentration AuNPs under 1× PBS. (e) AFM topographic image of the DMPC bilayer with a low concentration of AuNPs. (f) AFM topographic image and height section plot along the blue arrow of a DMPC bilayer with few AuNP(s) under 1× PBS in the “ripple” phase.38 Scale bars: 1 μm or otherwise specified.

