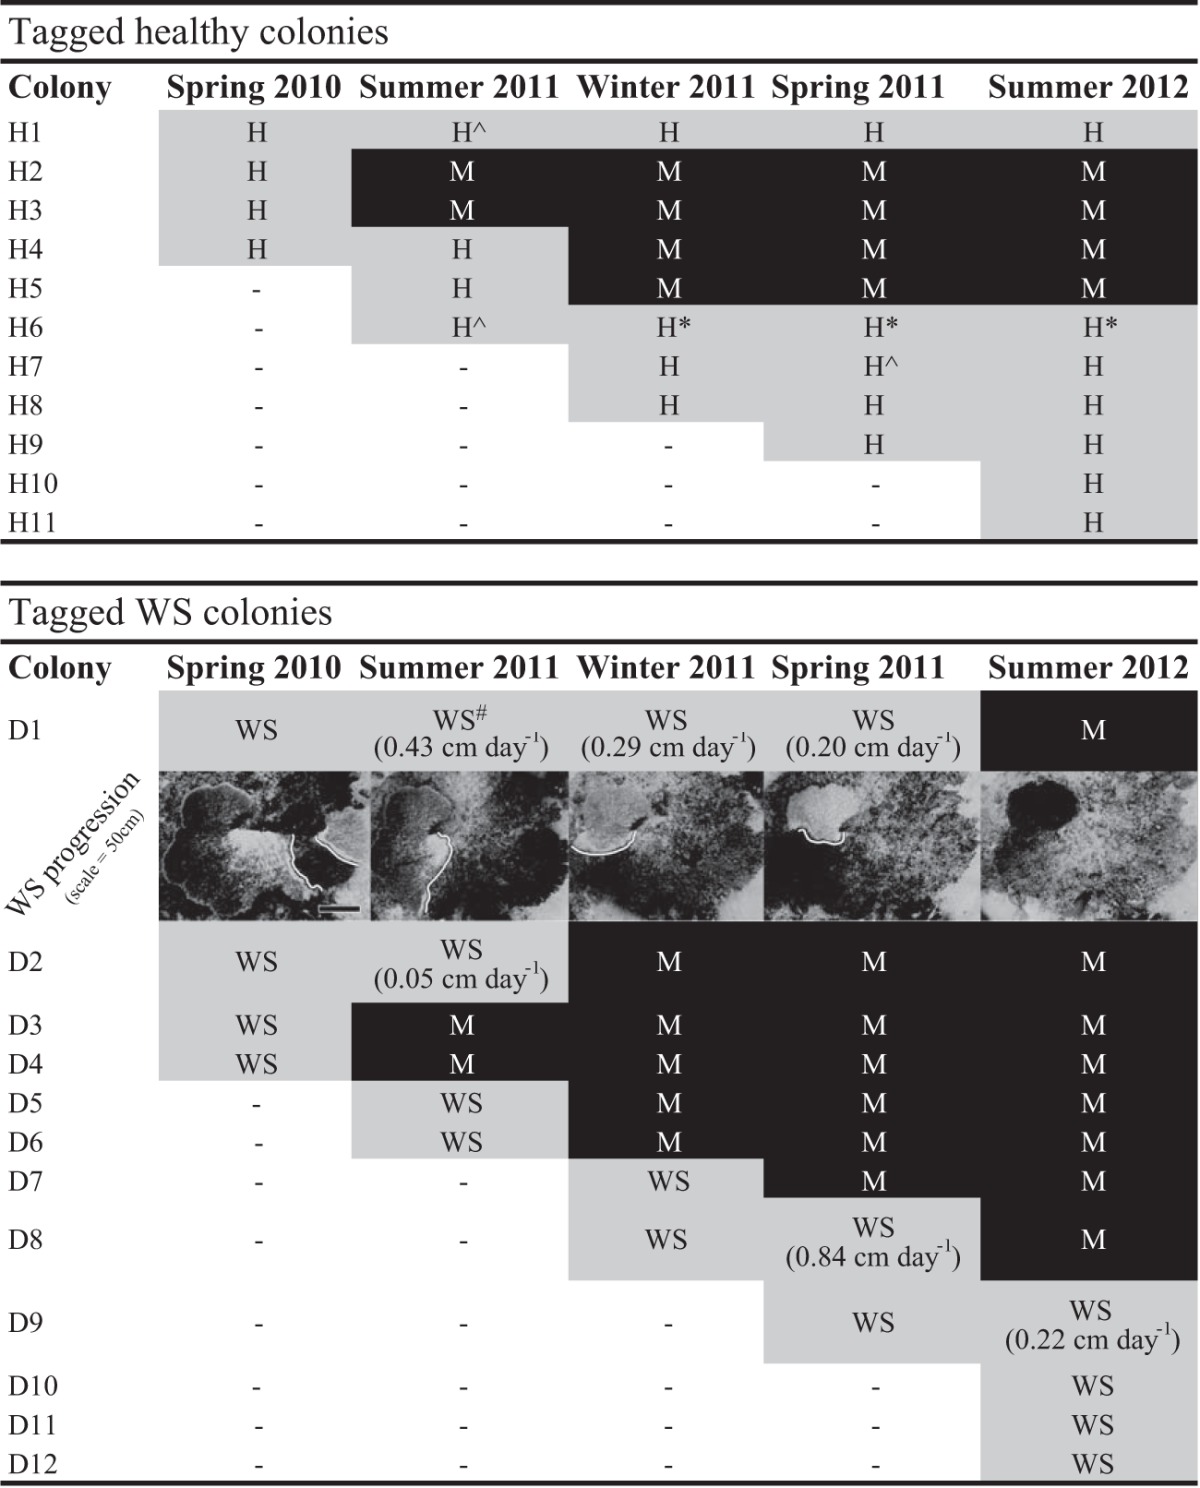
TABLE 1.
Disease progression and fate of tagged coloniesa

Images show lesion progression on colony D1. White lines are shown just behind the lesion front, and the black scale bar denotes 50 cm. Abbreviations and symbols: H, colony visually healthy; WS, colony displaying active white syndrome disease signs; M, colony dead (mortality); *, sample not analyzed due to Drupella sp. infestation; ^ and #, bacterial community profiling data unavailable for healthy or HD samples, respectively, due to insufficient sequencing reads. Information bounded by parentheses indicates the average lesion progression rate since the previous sampling time point.
