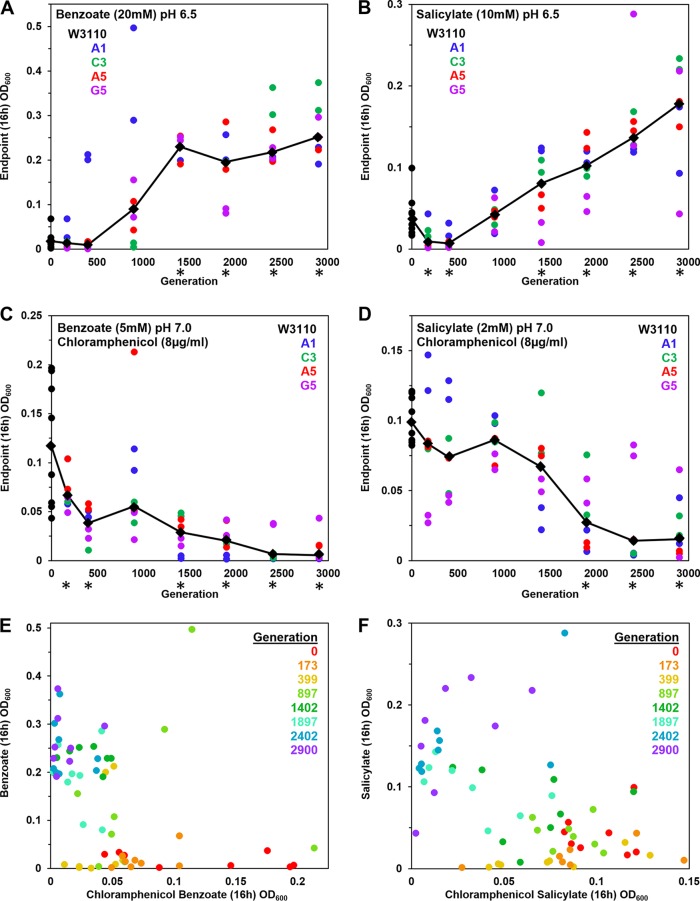
FIG 1.
Growth measured after generations of repeated dilution and culture in 5 to 20 mM benzoate. Benzoate-evolved strains were isolated from frozen microplates, selecting 2 different clones from each of 4 populations. Clones from each plate generation were cultured at 37°C in a column of microplate wells; cell density values (OD600) were obtained at 16 h. (A to D) The colored dots represent lineages of evolved clones collected from distinct well populations (A1, C3, A5, and G5) after different numbers of generations as indicated on the x axis. Diamonds indicate median cell density for each generation tested. Asterisks indicate generations for which the 16-h cell density differed significantly from that of the ancestral strain W3110 in 2 out of 3 trials of the entire microplate experiment. For each microplate trial, the Friedman test was performed with post hoc Conover pairwise comparisons and Holm-Bonferroni-adjusted P values. LBK medium contained (A) 100 mM PIPES at pH 6.5 with 20 mM benzoate (diluted 1:200 from overnight cultures with 5 mM benzoate), (B) 100 mM PIPES at pH 6.5 with 10 mM salicylate (diluted 1:200 from overnight cultures in 2 mM salicylate), (C) 100 mM MOPS at pH 7.0 with 5 mM benzoate and 8 μg/ml chloramphenicol (diluted 1:200 from overnight cultures lacking chloramphenicol), or (D) 100 mM MOPS at pH 7.0 with 2 mM salicylate and 8 μg/ml chloramphenicol (diluted 1:200 from overnight cultures lacking chloramphenicol). (E) Plot of 16-h cell density values for 20 mM benzoate and for 5 mM benzoate–8 μg/ml chloramphenicol exposures. (F) Plot of 16-h cell density values for 10 mM salicylate and for 2 mM salicylate–8 μg/ml chloramphenicol exposures.

