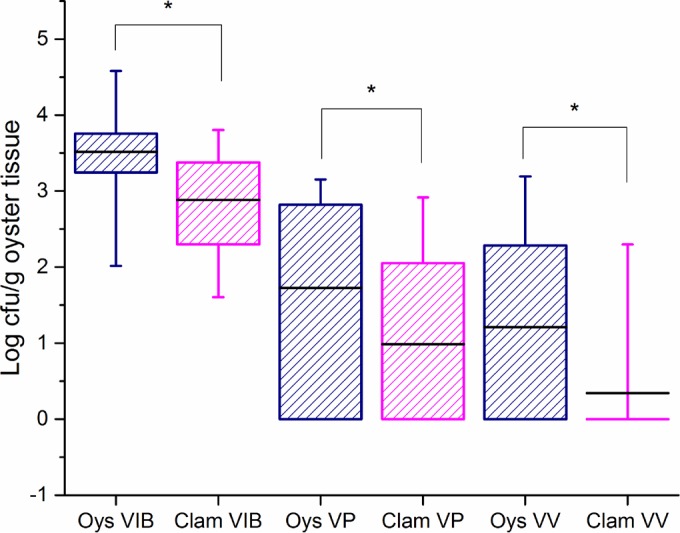
FIG 2.

Box plots of levels of total Vibrio spp. (VIB), V. parahaemolyticus (VP), and V. vulnificus (VV) in oysters (Oys) and clams. Horizontal black lines, means; boxes, 25th to 75th percentile values; whiskers, minimum and maximum values. *, significant difference in means.
