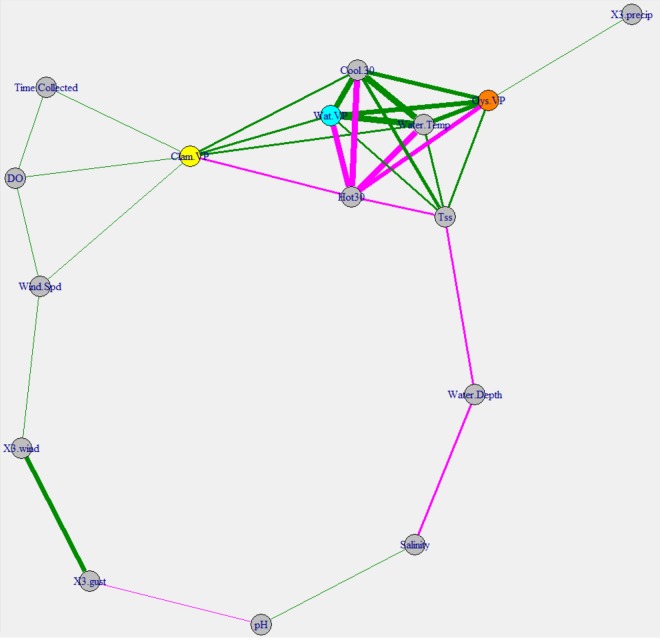
FIG 6.
Correlation network map for V. parahaemolyticus. The network is based on Spearman's rank correlation coefficients. Vertices are connected by edges only if the correlation coefficient is greater than 0.25. Edges are colored based on positive (green) or negative (magenta) correlations. The thickness of the edges represents the correlation strength. Vertices were arranged using the Fruchterman-Reingold method, which clusters similar vertices together. Three-day antecedent precipitation values (X3.precip) were summed, while 3-day antecedent wind speed (X3.wind) and wind gust (X3.gust) values were averaged. The values for heating degree days (Hot 30) and cooling degree days (Cool 30) were obtained by summing the degree days 30 days before (and including) the collection date. Vertices representing the V. parahaemolyticus concentrations in clams (Clam.VP), oysters (Oys.VP), and water (Wat.VP) are colored only for ease of viewing.

