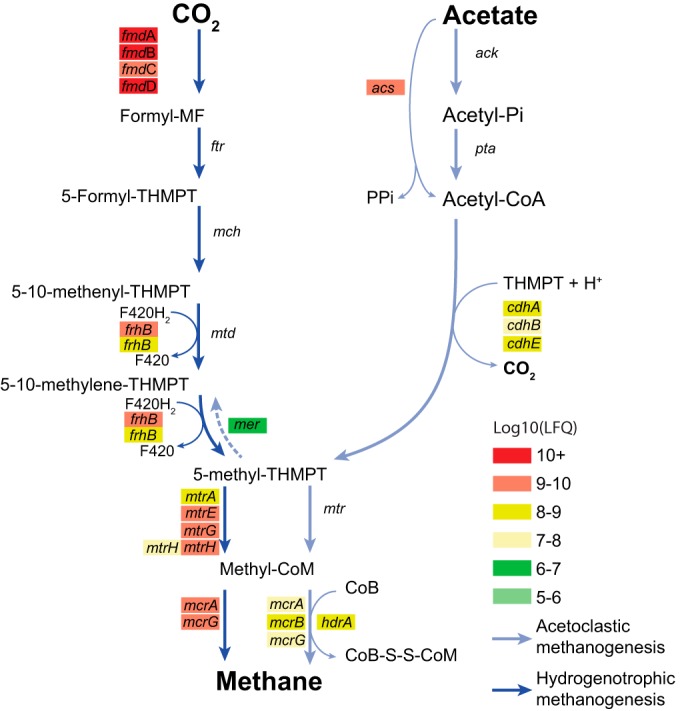
FIG 2.

Methanogenesis pathways in FrBGR operating at high temperature and high ammonia concentration. Genes are shown as colored boxes, where the color indicates the protein abundance (MaxQuant LFQ values) ranging from high abundance (red) to low abundance (green). Acetoclastic methanogenesis is shown by light blue lines, where all proteins were mapped to the reference genome of Methanosaeta thermophila PT. Pathways illustrated by dark blue lines represent hydrogenotrophic methanogenesis, and the proteins were mapped to Methanothermobacter thermoautotrophicus supplemented by the population bins of Methanothermobacter, Methanobacteriales, and Archaea. Abbreviations used in this figure can be found in Table S3 in the supplemental material. Subunits of multimeric protein complexes are indicated, if detected (A, B, C, etc.).
