
FIG 4.
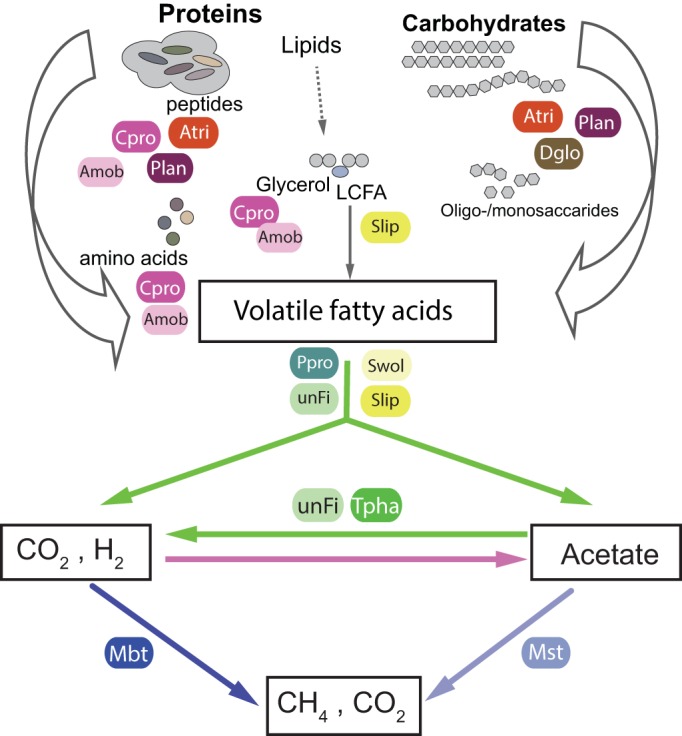
Hypothetical model of the carbon flux in FrBGR, with functional roles of dominant phylotypes inferred from comparison of metagenome and metaproteome data sets. Metabolic pathways showing the key stages (arrows) of acetogenesis (pink) and methanogenesis (blue), in addition to syntrophic metabolic processes (green). Only the most prominent (with regard to relative abundance in the 16S rRNA gene sequence inventory and protein abundance) phylotypes in the FrBGR microbial community were evaluated, and it should be noted that a rare portion of the population might account for underlying key metabolic pathways not shown here. Organism abbreviations used in this figure correspond to the population bin IDs listed in Table 2.