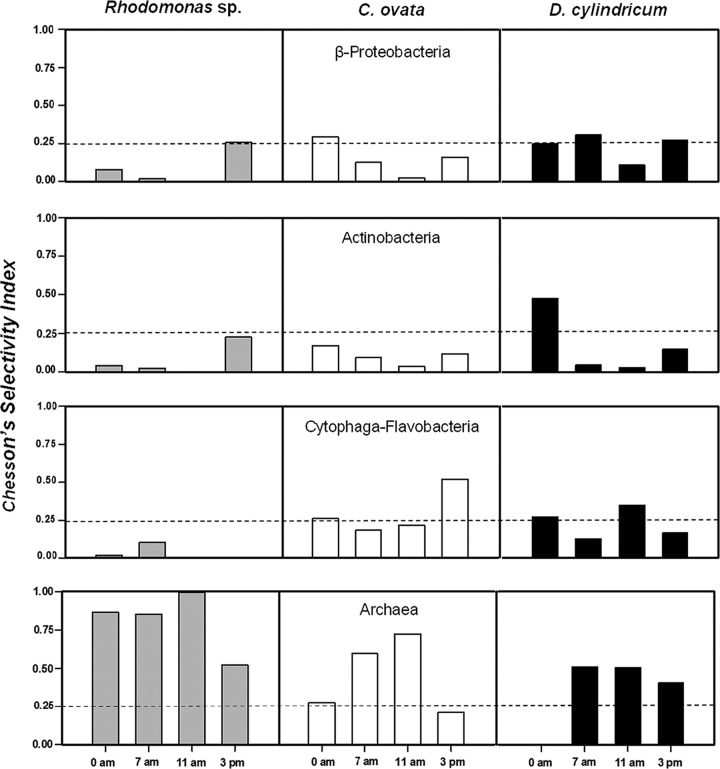
FIG 5.
Chesson's selectivity index for the three mixotrophic species (plots distributed vertically) and for each of the targeted prokaryotic groups (plots distributed horizontally) at each sampling time. The horizontal dashed lines indicate the value above which positive selection of a particular prokaryotic group is assumed (0.25 = 1/n, where n is the number of prokaryotic groups).

