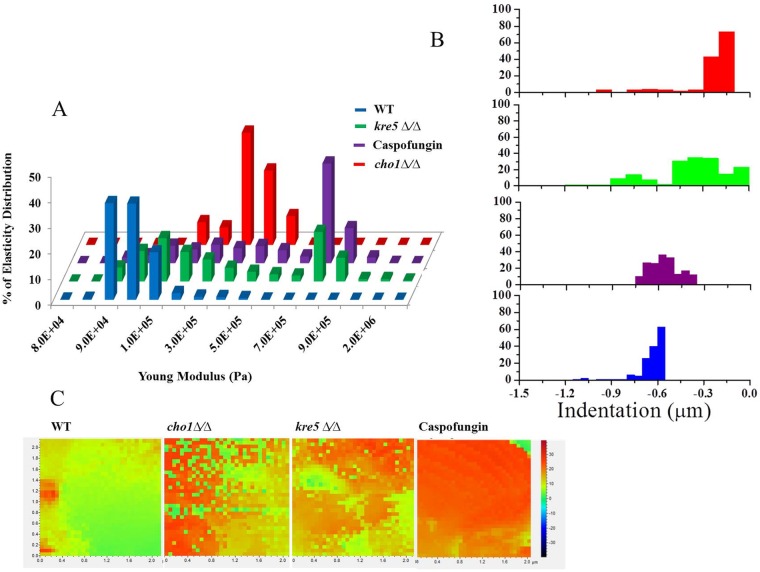
FIG 5.
Elasticity of cho1Δ/Δ, kre5Δ/Δ, and caspofungin-treated cells decreases compared to that of untreated wild-type cells. Force volume maps of the surface of wild-type cells, cho1Δ/Δ and kre5Δ/Δ mutant cells, along with caspofungin-treated wild-type C. albicans cells were taken by scanning a 2-μm2 area on the top of a cell and recording 32-by-32 points, with each point being the average of 3 force curves. These data were converted into elasticity and indentation maps by using PicoPlus AFM software. (A) Percent distributions of Young's modulus values corresponding to the elasticity maps of the wild-type, cho1Δ/Δ, and kre5Δ/Δ strains along with caspofungin-treated cells. (B) Representative histogram of the indentation values for the different strains and caspofungin-treated cells. (C) Heat map for the different strains and caspofungin-treated cells. The color map indicates the modulus of elasticity (in pascals) using force curves generated at each point on the cell surface. The more intense the red color, the less elastic (stiffer) the surface.

